Immigrants from Nigeria vs Estonian Ambulatory Disability
COMPARE
Immigrants from Nigeria
Estonian
Ambulatory Disability
Ambulatory Disability Comparison
Immigrants from Nigeria
Estonians
5.9%
AMBULATORY DISABILITY
90.9/ 100
METRIC RATING
127th/ 347
METRIC RANK
5.9%
AMBULATORY DISABILITY
92.9/ 100
METRIC RATING
120th/ 347
METRIC RANK
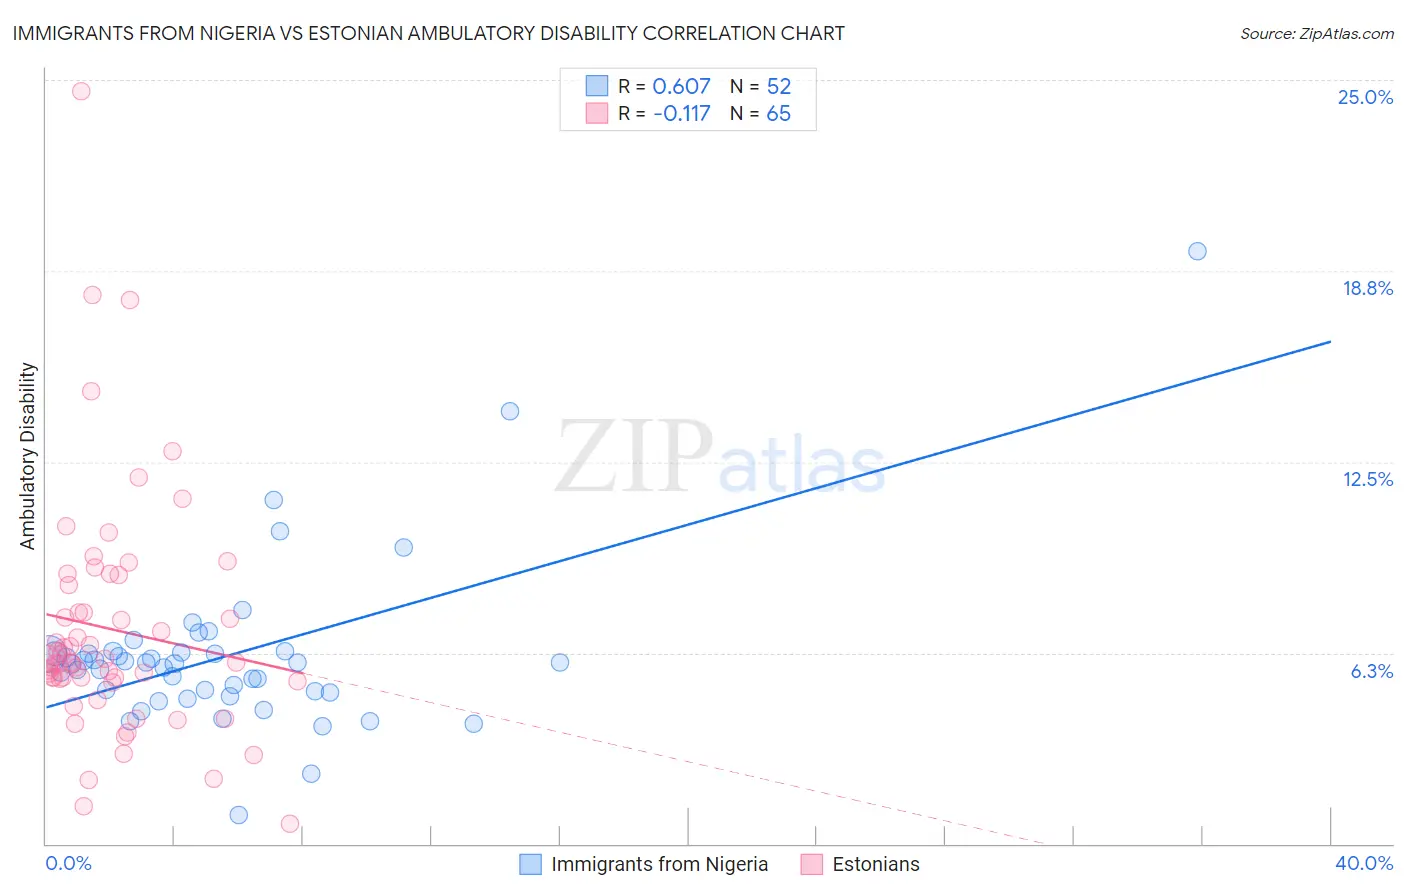
Immigrants from Nigeria vs Estonian Ambulatory Disability Correlation Chart
The statistical analysis conducted on geographies consisting of 283,430,784 people shows a significant positive correlation between the proportion of Immigrants from Nigeria and percentage of population with ambulatory disability in the United States with a correlation coefficient (R) of 0.607 and weighted average of 5.9%. Similarly, the statistical analysis conducted on geographies consisting of 123,516,931 people shows a poor negative correlation between the proportion of Estonians and percentage of population with ambulatory disability in the United States with a correlation coefficient (R) of -0.117 and weighted average of 5.9%, a difference of 0.37%.
Ambulatory Disability Correlation Summary
| Measurement | Immigrants from Nigeria | Estonian |
| Minimum | 0.93% | 0.64% |
| Maximum | 19.4% | 24.6% |
| Range | 18.5% | 24.0% |
| Mean | 6.2% | 7.0% |
| Median | 5.9% | 5.9% |
| Interquartile 25% (IQ1) | 5.0% | 5.4% |
| Interquartile 75% (IQ3) | 6.2% | 8.6% |
| Interquartile Range (IQR) | 1.3% | 3.3% |
| Standard Deviation (Sample) | 2.8% | 4.0% |
| Standard Deviation (Population) | 2.7% | 3.9% |
Demographics Similar to Immigrants from Nigeria and Estonians by Ambulatory Disability
In terms of ambulatory disability, the demographic groups most similar to Immigrants from Nigeria are Immigrants from Western Asia (5.9%, a difference of 0.040%), Immigrants from Norway (5.9%, a difference of 0.070%), Arab (5.9%, a difference of 0.10%), Korean (5.9%, a difference of 0.11%), and Immigrants from Kazakhstan (5.9%, a difference of 0.18%). Similarly, the demographic groups most similar to Estonians are Norwegian (5.9%, a difference of 0.040%), Costa Rican (5.9%, a difference of 0.070%), Icelander (5.9%, a difference of 0.070%), Immigrants from Russia (5.9%, a difference of 0.10%), and Russian (5.9%, a difference of 0.11%).
| Demographics | Rating | Rank | Ambulatory Disability |
| Immigrants | Uruguay | 95.6 /100 | #113 | Exceptional 5.9% |
| Immigrants | Poland | 95.4 /100 | #114 | Exceptional 5.9% |
| South American Indians | 94.8 /100 | #115 | Exceptional 5.9% |
| Immigrants | Africa | 94.7 /100 | #116 | Exceptional 5.9% |
| Immigrants | South Eastern Asia | 93.6 /100 | #117 | Exceptional 5.9% |
| Russians | 93.4 /100 | #118 | Exceptional 5.9% |
| Norwegians | 93.1 /100 | #119 | Exceptional 5.9% |
| Estonians | 92.9 /100 | #120 | Exceptional 5.9% |
| Costa Ricans | 92.6 /100 | #121 | Exceptional 5.9% |
| Icelanders | 92.6 /100 | #122 | Exceptional 5.9% |
| Immigrants | Russia | 92.4 /100 | #123 | Exceptional 5.9% |
| Immigrants | Middle Africa | 92.2 /100 | #124 | Exceptional 5.9% |
| Koreans | 91.6 /100 | #125 | Exceptional 5.9% |
| Arabs | 91.5 /100 | #126 | Exceptional 5.9% |
| Immigrants | Nigeria | 90.9 /100 | #127 | Exceptional 5.9% |
| Immigrants | Western Asia | 90.7 /100 | #128 | Exceptional 5.9% |
| Immigrants | Norway | 90.5 /100 | #129 | Exceptional 5.9% |
| Immigrants | Kazakhstan | 89.7 /100 | #130 | Excellent 5.9% |
| Immigrants | Costa Rica | 89.5 /100 | #131 | Excellent 5.9% |
| Immigrants | Europe | 87.8 /100 | #132 | Excellent 6.0% |
| Immigrants | Immigrants | 86.9 /100 | #133 | Excellent 6.0% |