Immigrants from Nigeria vs Immigrants from Moldova Ambulatory Disability
COMPARE
Immigrants from Nigeria
Immigrants from Moldova
Ambulatory Disability
Ambulatory Disability Comparison
Immigrants from Nigeria
Immigrants from Moldova
5.9%
AMBULATORY DISABILITY
90.9/ 100
METRIC RATING
127th/ 347
METRIC RANK
6.0%
AMBULATORY DISABILITY
82.4/ 100
METRIC RATING
147th/ 347
METRIC RANK
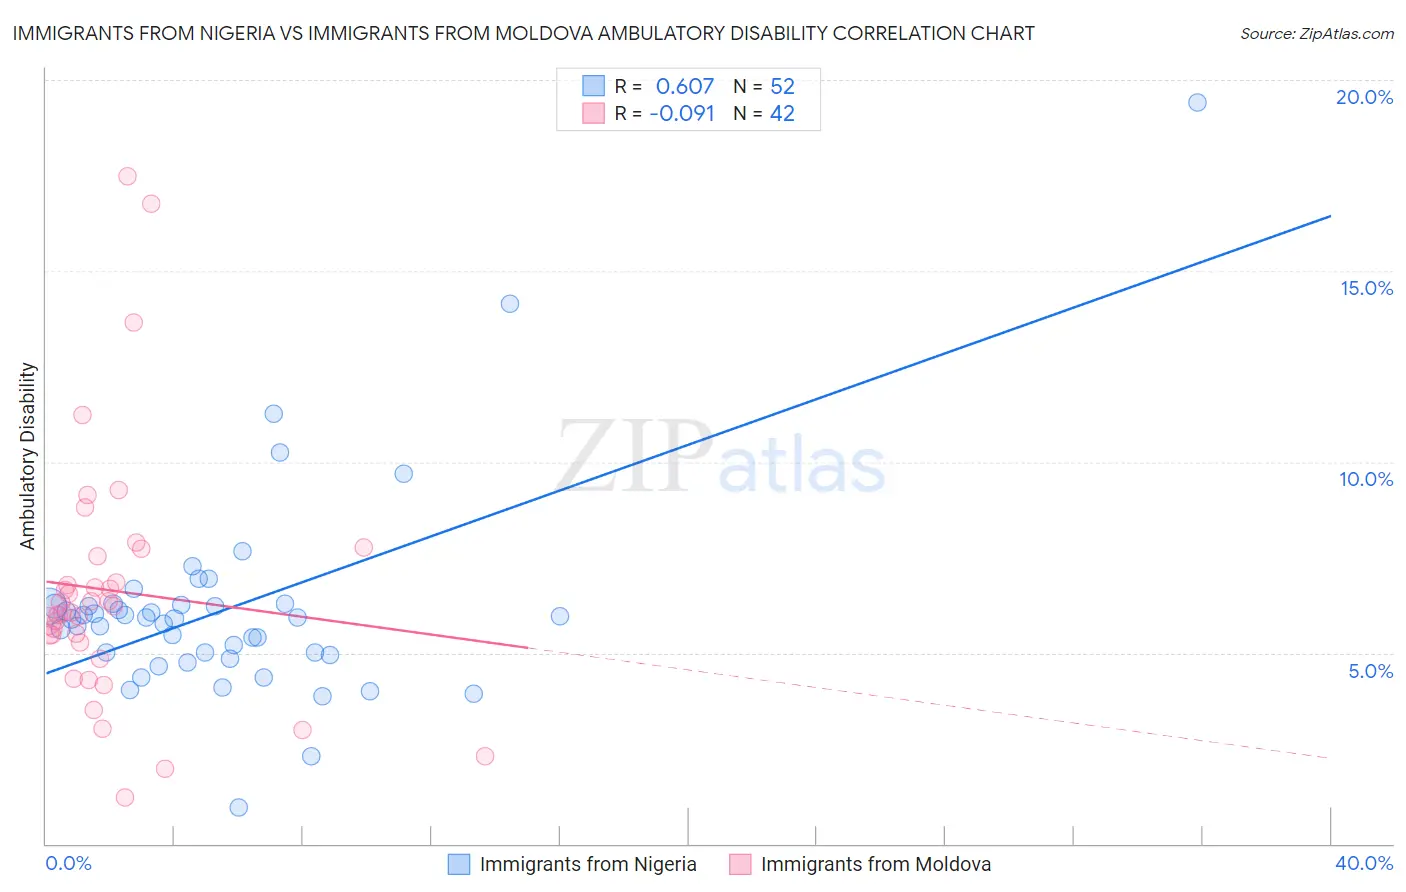
Immigrants from Nigeria vs Immigrants from Moldova Ambulatory Disability Correlation Chart
The statistical analysis conducted on geographies consisting of 283,430,784 people shows a significant positive correlation between the proportion of Immigrants from Nigeria and percentage of population with ambulatory disability in the United States with a correlation coefficient (R) of 0.607 and weighted average of 5.9%. Similarly, the statistical analysis conducted on geographies consisting of 124,381,325 people shows a slight negative correlation between the proportion of Immigrants from Moldova and percentage of population with ambulatory disability in the United States with a correlation coefficient (R) of -0.091 and weighted average of 6.0%, a difference of 1.0%.
Ambulatory Disability Correlation Summary
| Measurement | Immigrants from Nigeria | Immigrants from Moldova |
| Minimum | 0.93% | 1.2% |
| Maximum | 19.4% | 17.5% |
| Range | 18.5% | 16.3% |
| Mean | 6.2% | 6.6% |
| Median | 5.9% | 6.1% |
| Interquartile 25% (IQ1) | 5.0% | 5.3% |
| Interquartile 75% (IQ3) | 6.2% | 7.5% |
| Interquartile Range (IQR) | 1.3% | 2.2% |
| Standard Deviation (Sample) | 2.8% | 3.3% |
| Standard Deviation (Population) | 2.7% | 3.3% |
Demographics Similar to Immigrants from Nigeria and Immigrants from Moldova by Ambulatory Disability
In terms of ambulatory disability, the demographic groups most similar to Immigrants from Nigeria are Immigrants from Western Asia (5.9%, a difference of 0.040%), Immigrants from Norway (5.9%, a difference of 0.070%), Immigrants from Kazakhstan (5.9%, a difference of 0.18%), Immigrants from Costa Rica (5.9%, a difference of 0.21%), and Immigrants from Europe (6.0%, a difference of 0.45%). Similarly, the demographic groups most similar to Immigrants from Moldova are Pakistani (6.0%, a difference of 0.010%), Immigrants from Greece (6.0%, a difference of 0.010%), Macedonian (6.0%, a difference of 0.040%), Romanian (6.0%, a difference of 0.050%), and Swedish (6.0%, a difference of 0.060%).
| Demographics | Rating | Rank | Ambulatory Disability |
| Immigrants | Nigeria | 90.9 /100 | #127 | Exceptional 5.9% |
| Immigrants | Western Asia | 90.7 /100 | #128 | Exceptional 5.9% |
| Immigrants | Norway | 90.5 /100 | #129 | Exceptional 5.9% |
| Immigrants | Kazakhstan | 89.7 /100 | #130 | Excellent 5.9% |
| Immigrants | Costa Rica | 89.5 /100 | #131 | Excellent 5.9% |
| Immigrants | Europe | 87.8 /100 | #132 | Excellent 6.0% |
| Immigrants | Immigrants | 86.9 /100 | #133 | Excellent 6.0% |
| Ute | 86.6 /100 | #134 | Excellent 6.0% |
| Immigrants | Italy | 85.0 /100 | #135 | Excellent 6.0% |
| Immigrants | North Macedonia | 84.1 /100 | #136 | Excellent 6.0% |
| Immigrants | Syria | 84.1 /100 | #137 | Excellent 6.0% |
| Immigrants | Hungary | 83.9 /100 | #138 | Excellent 6.0% |
| Immigrants | Zaire | 83.6 /100 | #139 | Excellent 6.0% |
| Czechs | 83.3 /100 | #140 | Excellent 6.0% |
| Swedes | 83.1 /100 | #141 | Excellent 6.0% |
| Immigrants | Philippines | 83.0 /100 | #142 | Excellent 6.0% |
| Romanians | 82.9 /100 | #143 | Excellent 6.0% |
| Macedonians | 82.8 /100 | #144 | Excellent 6.0% |
| Pakistanis | 82.5 /100 | #145 | Excellent 6.0% |
| Immigrants | Greece | 82.5 /100 | #146 | Excellent 6.0% |
| Immigrants | Moldova | 82.4 /100 | #147 | Excellent 6.0% |