Immigrants from Armenia vs Immigrants from Yemen Disability
COMPARE
Immigrants from Armenia
Immigrants from Yemen
Disability
Disability Comparison
Immigrants from Armenia
Immigrants from Yemen
11.7%
DISABILITY
41.9/ 100
METRIC RATING
179th/ 347
METRIC RANK
12.6%
DISABILITY
0.1/ 100
METRIC RATING
271st/ 347
METRIC RANK
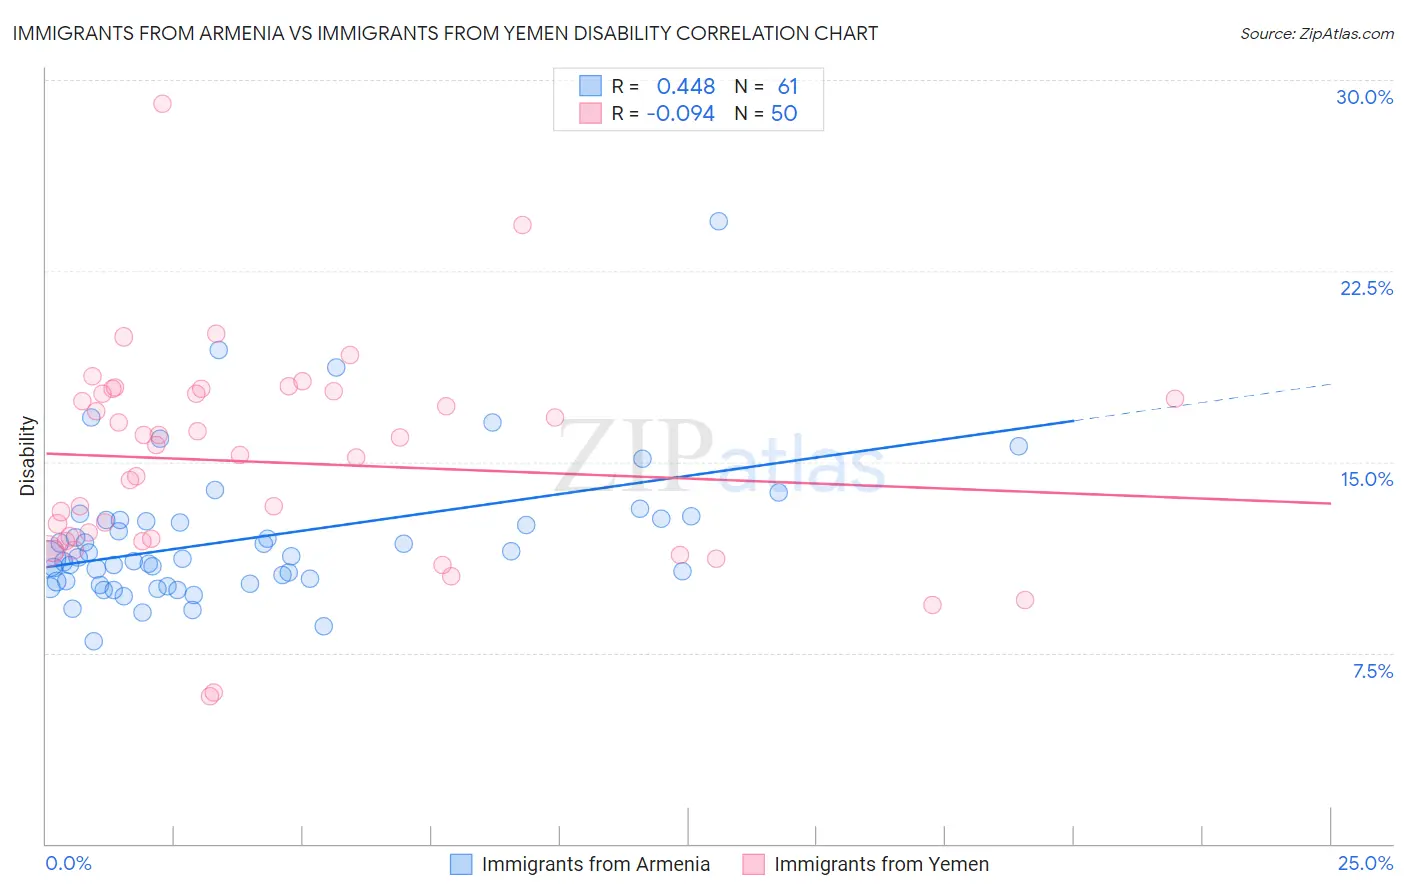
Immigrants from Armenia vs Immigrants from Yemen Disability Correlation Chart
The statistical analysis conducted on geographies consisting of 97,710,593 people shows a moderate positive correlation between the proportion of Immigrants from Armenia and percentage of population with a disability in the United States with a correlation coefficient (R) of 0.448 and weighted average of 11.7%. Similarly, the statistical analysis conducted on geographies consisting of 82,432,981 people shows a slight negative correlation between the proportion of Immigrants from Yemen and percentage of population with a disability in the United States with a correlation coefficient (R) of -0.094 and weighted average of 12.6%, a difference of 7.6%.
Disability Correlation Summary
| Measurement | Immigrants from Armenia | Immigrants from Yemen |
| Minimum | 7.9% | 5.8% |
| Maximum | 24.5% | 29.1% |
| Range | 16.5% | 23.3% |
| Mean | 12.0% | 15.0% |
| Median | 11.2% | 15.5% |
| Interquartile 25% (IQ1) | 10.3% | 11.9% |
| Interquartile 75% (IQ3) | 12.7% | 17.7% |
| Interquartile Range (IQR) | 2.5% | 5.8% |
| Standard Deviation (Sample) | 2.8% | 4.2% |
| Standard Deviation (Population) | 2.8% | 4.1% |
Similar Demographics by Disability
Demographics Similar to Immigrants from Armenia by Disability
In terms of disability, the demographic groups most similar to Immigrants from Armenia are Greek (11.7%, a difference of 0.19%), Immigrants from Honduras (11.8%, a difference of 0.19%), Immigrants from Central America (11.7%, a difference of 0.21%), Immigrants from Western Africa (11.7%, a difference of 0.25%), and Haitian (11.7%, a difference of 0.30%).
| Demographics | Rating | Rank | Disability |
| Trinidadians and Tobagonians | 52.7 /100 | #172 | Average 11.7% |
| Maltese | 50.6 /100 | #173 | Average 11.7% |
| Albanians | 50.0 /100 | #174 | Average 11.7% |
| Haitians | 48.6 /100 | #175 | Average 11.7% |
| Immigrants | Western Africa | 47.5 /100 | #176 | Average 11.7% |
| Immigrants | Central America | 46.6 /100 | #177 | Average 11.7% |
| Greeks | 46.2 /100 | #178 | Average 11.7% |
| Immigrants | Armenia | 41.9 /100 | #179 | Average 11.7% |
| Immigrants | Honduras | 37.8 /100 | #180 | Fair 11.8% |
| Immigrants | Oceania | 34.3 /100 | #181 | Fair 11.8% |
| Icelanders | 34.0 /100 | #182 | Fair 11.8% |
| Hondurans | 31.2 /100 | #183 | Fair 11.8% |
| Iraqis | 30.0 /100 | #184 | Fair 11.8% |
| Immigrants | Burma/Myanmar | 28.5 /100 | #185 | Fair 11.8% |
| Immigrants | Scotland | 28.2 /100 | #186 | Fair 11.8% |
Demographics Similar to Immigrants from Yemen by Disability
In terms of disability, the demographic groups most similar to Immigrants from Yemen are Portuguese (12.6%, a difference of 0.050%), Immigrants from Dominican Republic (12.6%, a difference of 0.44%), Dominican (12.7%, a difference of 0.49%), Bangladeshi (12.6%, a difference of 0.53%), and Finnish (12.7%, a difference of 0.66%).
| Demographics | Rating | Rank | Disability |
| Immigrants | Germany | 0.2 /100 | #264 | Tragic 12.5% |
| U.S. Virgin Islanders | 0.2 /100 | #265 | Tragic 12.5% |
| Czechoslovakians | 0.2 /100 | #266 | Tragic 12.5% |
| Spaniards | 0.2 /100 | #267 | Tragic 12.5% |
| Bangladeshis | 0.1 /100 | #268 | Tragic 12.6% |
| Immigrants | Dominican Republic | 0.1 /100 | #269 | Tragic 12.6% |
| Portuguese | 0.1 /100 | #270 | Tragic 12.6% |
| Immigrants | Yemen | 0.1 /100 | #271 | Tragic 12.6% |
| Dominicans | 0.0 /100 | #272 | Tragic 12.7% |
| Finns | 0.0 /100 | #273 | Tragic 12.7% |
| Nepalese | 0.0 /100 | #274 | Tragic 12.8% |
| Sioux | 0.0 /100 | #275 | Tragic 12.8% |
| Hmong | 0.0 /100 | #276 | Tragic 12.8% |
| Dutch | 0.0 /100 | #277 | Tragic 12.8% |
| Germans | 0.0 /100 | #278 | Tragic 12.8% |