Sudanese vs Immigrants from Germany Disability
COMPARE
Sudanese
Immigrants from Germany
Disability
Disability Comparison
Sudanese
Immigrants from Germany
11.5%
DISABILITY
77.1/ 100
METRIC RATING
148th/ 347
METRIC RANK
12.5%
DISABILITY
0.2/ 100
METRIC RATING
264th/ 347
METRIC RANK
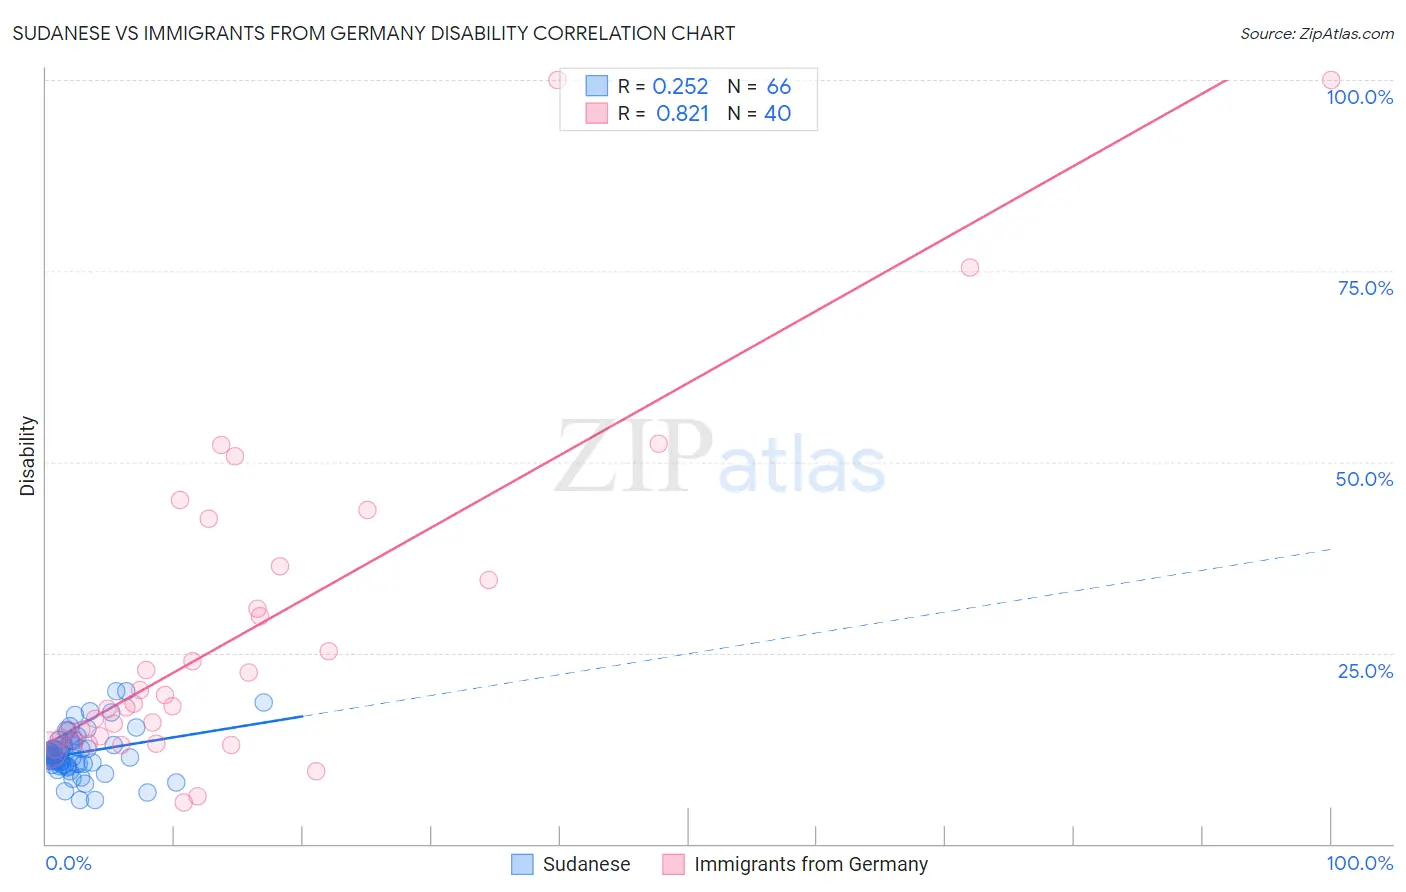
Sudanese vs Immigrants from Germany Disability Correlation Chart
The statistical analysis conducted on geographies consisting of 110,141,954 people shows a weak positive correlation between the proportion of Sudanese and percentage of population with a disability in the United States with a correlation coefficient (R) of 0.252 and weighted average of 11.5%. Similarly, the statistical analysis conducted on geographies consisting of 463,872,801 people shows a very strong positive correlation between the proportion of Immigrants from Germany and percentage of population with a disability in the United States with a correlation coefficient (R) of 0.821 and weighted average of 12.5%, a difference of 8.2%.
Disability Correlation Summary
| Measurement | Sudanese | Immigrants from Germany |
| Minimum | 5.7% | 5.3% |
| Maximum | 20.0% | 100.0% |
| Range | 14.3% | 94.7% |
| Mean | 11.9% | 27.9% |
| Median | 11.7% | 18.2% |
| Interquartile 25% (IQ1) | 10.3% | 13.7% |
| Interquartile 75% (IQ3) | 13.0% | 35.4% |
| Interquartile Range (IQR) | 2.7% | 21.7% |
| Standard Deviation (Sample) | 2.9% | 22.6% |
| Standard Deviation (Population) | 2.9% | 22.3% |
Similar Demographics by Disability
Demographics Similar to Sudanese by Disability
In terms of disability, the demographic groups most similar to Sudanese are Immigrants from Ukraine (11.5%, a difference of 0.030%), Immigrants from Hungary (11.5%, a difference of 0.12%), Immigrants from Norway (11.6%, a difference of 0.24%), Romanian (11.6%, a difference of 0.27%), and Nigerian (11.5%, a difference of 0.29%).
| Demographics | Rating | Rank | Disability |
| Immigrants | Grenada | 86.1 /100 | #141 | Excellent 11.5% |
| Immigrants | Sudan | 85.3 /100 | #142 | Excellent 11.5% |
| Moroccans | 83.3 /100 | #143 | Excellent 11.5% |
| Australians | 82.5 /100 | #144 | Excellent 11.5% |
| Nigerians | 81.3 /100 | #145 | Excellent 11.5% |
| Immigrants | Hungary | 79.0 /100 | #146 | Good 11.5% |
| Immigrants | Ukraine | 77.6 /100 | #147 | Good 11.5% |
| Sudanese | 77.1 /100 | #148 | Good 11.5% |
| Immigrants | Norway | 73.2 /100 | #149 | Good 11.6% |
| Romanians | 72.7 /100 | #150 | Good 11.6% |
| Immigrants | Kenya | 72.1 /100 | #151 | Good 11.6% |
| Immigrants | Moldova | 72.0 /100 | #152 | Good 11.6% |
| Immigrants | Ghana | 71.2 /100 | #153 | Good 11.6% |
| Immigrants | Guatemala | 71.1 /100 | #154 | Good 11.6% |
| Immigrants | Netherlands | 69.8 /100 | #155 | Good 11.6% |
Demographics Similar to Immigrants from Germany by Disability
In terms of disability, the demographic groups most similar to Immigrants from Germany are U.S. Virgin Islander (12.5%, a difference of 0.020%), Hawaiian (12.5%, a difference of 0.11%), Czechoslovakian (12.5%, a difference of 0.18%), Spaniard (12.5%, a difference of 0.26%), and Native Hawaiian (12.5%, a difference of 0.32%).
| Demographics | Rating | Rank | Disability |
| Immigrants | Laos | 0.5 /100 | #257 | Tragic 12.4% |
| Slavs | 0.5 /100 | #258 | Tragic 12.4% |
| Canadians | 0.4 /100 | #259 | Tragic 12.4% |
| Immigrants | Liberia | 0.4 /100 | #260 | Tragic 12.4% |
| Scandinavians | 0.4 /100 | #261 | Tragic 12.4% |
| Native Hawaiians | 0.3 /100 | #262 | Tragic 12.5% |
| Hawaiians | 0.2 /100 | #263 | Tragic 12.5% |
| Immigrants | Germany | 0.2 /100 | #264 | Tragic 12.5% |
| U.S. Virgin Islanders | 0.2 /100 | #265 | Tragic 12.5% |
| Czechoslovakians | 0.2 /100 | #266 | Tragic 12.5% |
| Spaniards | 0.2 /100 | #267 | Tragic 12.5% |
| Bangladeshis | 0.1 /100 | #268 | Tragic 12.6% |
| Immigrants | Dominican Republic | 0.1 /100 | #269 | Tragic 12.6% |
| Portuguese | 0.1 /100 | #270 | Tragic 12.6% |
| Immigrants | Yemen | 0.1 /100 | #271 | Tragic 12.6% |