Immigrants from Portugal vs Immigrants from Germany Disability
COMPARE
Immigrants from Portugal
Immigrants from Germany
Disability
Disability Comparison
Immigrants from Portugal
Immigrants from Germany
12.9%
DISABILITY
0.0/ 100
METRIC RATING
281st/ 347
METRIC RANK
12.5%
DISABILITY
0.2/ 100
METRIC RATING
264th/ 347
METRIC RANK
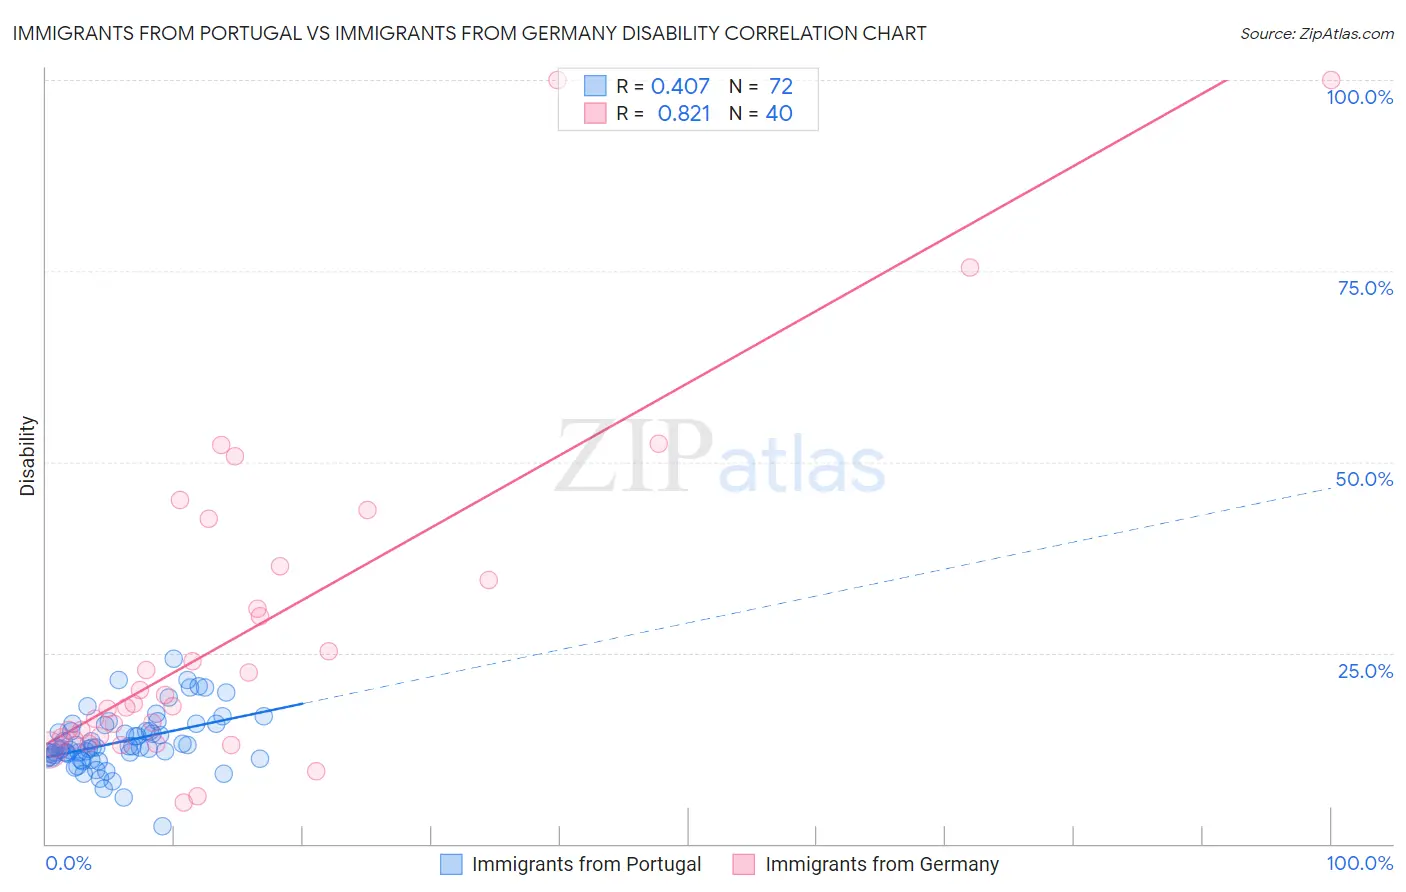
Immigrants from Portugal vs Immigrants from Germany Disability Correlation Chart
The statistical analysis conducted on geographies consisting of 174,786,483 people shows a moderate positive correlation between the proportion of Immigrants from Portugal and percentage of population with a disability in the United States with a correlation coefficient (R) of 0.407 and weighted average of 12.9%. Similarly, the statistical analysis conducted on geographies consisting of 463,872,801 people shows a very strong positive correlation between the proportion of Immigrants from Germany and percentage of population with a disability in the United States with a correlation coefficient (R) of 0.821 and weighted average of 12.5%, a difference of 3.0%.
Disability Correlation Summary
| Measurement | Immigrants from Portugal | Immigrants from Germany |
| Minimum | 2.3% | 5.3% |
| Maximum | 24.2% | 100.0% |
| Range | 21.9% | 94.7% |
| Mean | 13.4% | 27.9% |
| Median | 12.6% | 18.2% |
| Interquartile 25% (IQ1) | 11.4% | 13.7% |
| Interquartile 75% (IQ3) | 15.2% | 35.4% |
| Interquartile Range (IQR) | 3.7% | 21.7% |
| Standard Deviation (Sample) | 3.8% | 22.6% |
| Standard Deviation (Population) | 3.7% | 22.3% |
Demographics Similar to Immigrants from Portugal and Immigrants from Germany by Disability
In terms of disability, the demographic groups most similar to Immigrants from Portugal are Spanish (12.8%, a difference of 0.14%), Scottish (12.9%, a difference of 0.14%), Fijian (12.8%, a difference of 0.19%), German (12.8%, a difference of 0.29%), and Dutch (12.8%, a difference of 0.46%). Similarly, the demographic groups most similar to Immigrants from Germany are U.S. Virgin Islander (12.5%, a difference of 0.020%), Hawaiian (12.5%, a difference of 0.11%), Czechoslovakian (12.5%, a difference of 0.18%), Spaniard (12.5%, a difference of 0.26%), and Native Hawaiian (12.5%, a difference of 0.32%).
| Demographics | Rating | Rank | Disability |
| Native Hawaiians | 0.3 /100 | #262 | Tragic 12.5% |
| Hawaiians | 0.2 /100 | #263 | Tragic 12.5% |
| Immigrants | Germany | 0.2 /100 | #264 | Tragic 12.5% |
| U.S. Virgin Islanders | 0.2 /100 | #265 | Tragic 12.5% |
| Czechoslovakians | 0.2 /100 | #266 | Tragic 12.5% |
| Spaniards | 0.2 /100 | #267 | Tragic 12.5% |
| Bangladeshis | 0.1 /100 | #268 | Tragic 12.6% |
| Immigrants | Dominican Republic | 0.1 /100 | #269 | Tragic 12.6% |
| Portuguese | 0.1 /100 | #270 | Tragic 12.6% |
| Immigrants | Yemen | 0.1 /100 | #271 | Tragic 12.6% |
| Dominicans | 0.0 /100 | #272 | Tragic 12.7% |
| Finns | 0.0 /100 | #273 | Tragic 12.7% |
| Nepalese | 0.0 /100 | #274 | Tragic 12.8% |
| Sioux | 0.0 /100 | #275 | Tragic 12.8% |
| Hmong | 0.0 /100 | #276 | Tragic 12.8% |
| Dutch | 0.0 /100 | #277 | Tragic 12.8% |
| Germans | 0.0 /100 | #278 | Tragic 12.8% |
| Fijians | 0.0 /100 | #279 | Tragic 12.8% |
| Spanish | 0.0 /100 | #280 | Tragic 12.8% |
| Immigrants | Portugal | 0.0 /100 | #281 | Tragic 12.9% |
| Scottish | 0.0 /100 | #282 | Tragic 12.9% |