Immigrants from Caribbean vs Immigrants from Saudi Arabia Disability Age Under 5
COMPARE
Immigrants from Caribbean
Immigrants from Saudi Arabia
Disability Age Under 5
Disability Age Under 5 Comparison
Immigrants from Caribbean
Immigrants from Saudi Arabia
1.2%
DISABILITY AGE UNDER 5
93.8/ 100
METRIC RATING
115th/ 347
METRIC RANK
1.2%
DISABILITY AGE UNDER 5
43.3/ 100
METRIC RATING
183rd/ 347
METRIC RANK
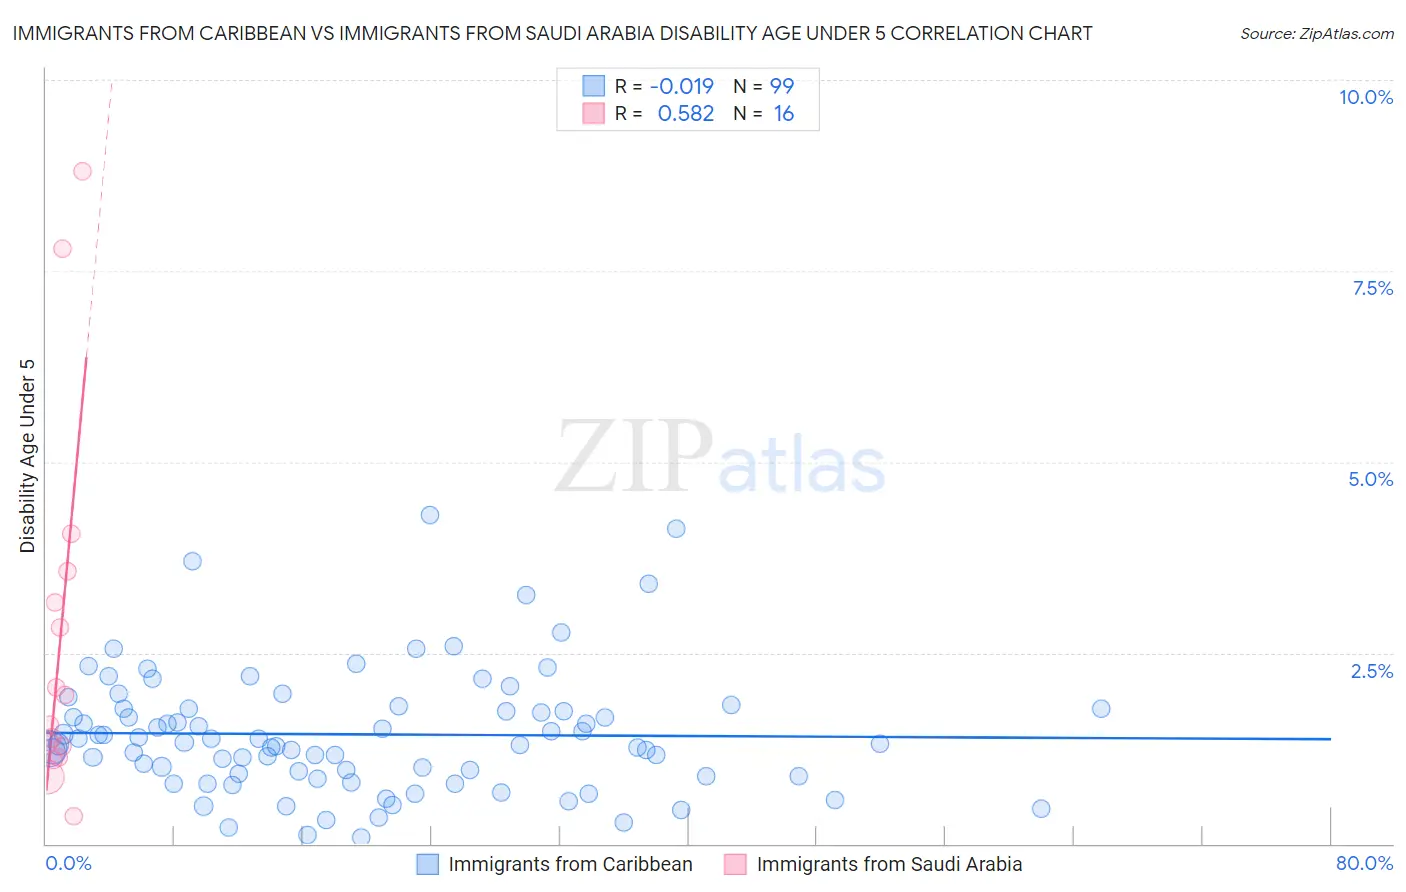
Immigrants from Caribbean vs Immigrants from Saudi Arabia Disability Age Under 5 Correlation Chart
The statistical analysis conducted on geographies consisting of 233,002,612 people shows no correlation between the proportion of Immigrants from Caribbean and percentage of population with a disability under the age of 5 in the United States with a correlation coefficient (R) of -0.019 and weighted average of 1.2%. Similarly, the statistical analysis conducted on geographies consisting of 116,171,188 people shows a substantial positive correlation between the proportion of Immigrants from Saudi Arabia and percentage of population with a disability under the age of 5 in the United States with a correlation coefficient (R) of 0.582 and weighted average of 1.2%, a difference of 7.2%.
Disability Age Under 5 Correlation Summary
| Measurement | Immigrants from Caribbean | Immigrants from Saudi Arabia |
| Minimum | 0.090% | 0.35% |
| Maximum | 4.3% | 8.8% |
| Range | 4.2% | 8.5% |
| Mean | 1.4% | 2.7% |
| Median | 1.3% | 1.8% |
| Interquartile 25% (IQ1) | 0.88% | 1.2% |
| Interquartile 75% (IQ3) | 1.8% | 3.4% |
| Interquartile Range (IQR) | 0.88% | 2.2% |
| Standard Deviation (Sample) | 0.81% | 2.4% |
| Standard Deviation (Population) | 0.80% | 2.3% |
Similar Demographics by Disability Age Under 5
Demographics Similar to Immigrants from Caribbean by Disability Age Under 5
In terms of disability age under 5, the demographic groups most similar to Immigrants from Caribbean are Belizean (1.2%, a difference of 0.010%), Immigrants from Northern Africa (1.2%, a difference of 0.020%), Immigrants from Philippines (1.2%, a difference of 0.15%), Immigrants from Oceania (1.2%, a difference of 0.16%), and Immigrants from Venezuela (1.2%, a difference of 0.19%).
| Demographics | Rating | Rank | Disability Age Under 5 |
| Iraqis | 95.1 /100 | #108 | Exceptional 1.2% |
| Immigrants | Panama | 95.0 /100 | #109 | Exceptional 1.2% |
| Immigrants | Lebanon | 95.0 /100 | #110 | Exceptional 1.2% |
| Senegalese | 94.6 /100 | #111 | Exceptional 1.2% |
| Immigrants | Australia | 94.4 /100 | #112 | Exceptional 1.2% |
| Immigrants | Oceania | 94.2 /100 | #113 | Exceptional 1.2% |
| Belizeans | 93.9 /100 | #114 | Exceptional 1.2% |
| Immigrants | Caribbean | 93.8 /100 | #115 | Exceptional 1.2% |
| Immigrants | Northern Africa | 93.8 /100 | #116 | Exceptional 1.2% |
| Immigrants | Philippines | 93.5 /100 | #117 | Exceptional 1.2% |
| Immigrants | Venezuela | 93.4 /100 | #118 | Exceptional 1.2% |
| Bhutanese | 92.5 /100 | #119 | Exceptional 1.2% |
| Immigrants | Eritrea | 92.3 /100 | #120 | Exceptional 1.2% |
| Immigrants | Senegal | 91.4 /100 | #121 | Exceptional 1.2% |
| Aleuts | 90.7 /100 | #122 | Exceptional 1.2% |
Demographics Similar to Immigrants from Saudi Arabia by Disability Age Under 5
In terms of disability age under 5, the demographic groups most similar to Immigrants from Saudi Arabia are Palestinian (1.2%, a difference of 0.020%), Macedonian (1.2%, a difference of 0.040%), Immigrants from Peru (1.2%, a difference of 0.040%), Immigrants from Western Africa (1.2%, a difference of 0.070%), and Cuban (1.2%, a difference of 0.080%).
| Demographics | Rating | Rank | Disability Age Under 5 |
| Immigrants | Kenya | 48.6 /100 | #176 | Average 1.2% |
| Comanche | 47.5 /100 | #177 | Average 1.2% |
| Venezuelans | 47.1 /100 | #178 | Average 1.2% |
| Immigrants | Bahamas | 45.2 /100 | #179 | Average 1.2% |
| Immigrants | Mexico | 44.4 /100 | #180 | Average 1.2% |
| Macedonians | 43.7 /100 | #181 | Average 1.2% |
| Immigrants | Peru | 43.7 /100 | #181 | Average 1.2% |
| Immigrants | Saudi Arabia | 43.3 /100 | #183 | Average 1.2% |
| Palestinians | 43.0 /100 | #184 | Average 1.2% |
| Immigrants | Western Africa | 42.5 /100 | #185 | Average 1.2% |
| Cubans | 42.5 /100 | #186 | Average 1.2% |
| Immigrants | Haiti | 40.2 /100 | #187 | Average 1.3% |
| Haitians | 39.9 /100 | #188 | Fair 1.3% |
| Peruvians | 37.6 /100 | #189 | Fair 1.3% |
| Immigrants | Laos | 36.6 /100 | #190 | Fair 1.3% |