Immigrants from Caribbean vs Dominican Disability Age Under 5
COMPARE
Immigrants from Caribbean
Dominican
Disability Age Under 5
Disability Age Under 5 Comparison
Immigrants from Caribbean
Dominicans
1.2%
DISABILITY AGE UNDER 5
93.8/ 100
METRIC RATING
115th/ 347
METRIC RANK
1.1%
DISABILITY AGE UNDER 5
96.3/ 100
METRIC RATING
99th/ 347
METRIC RANK
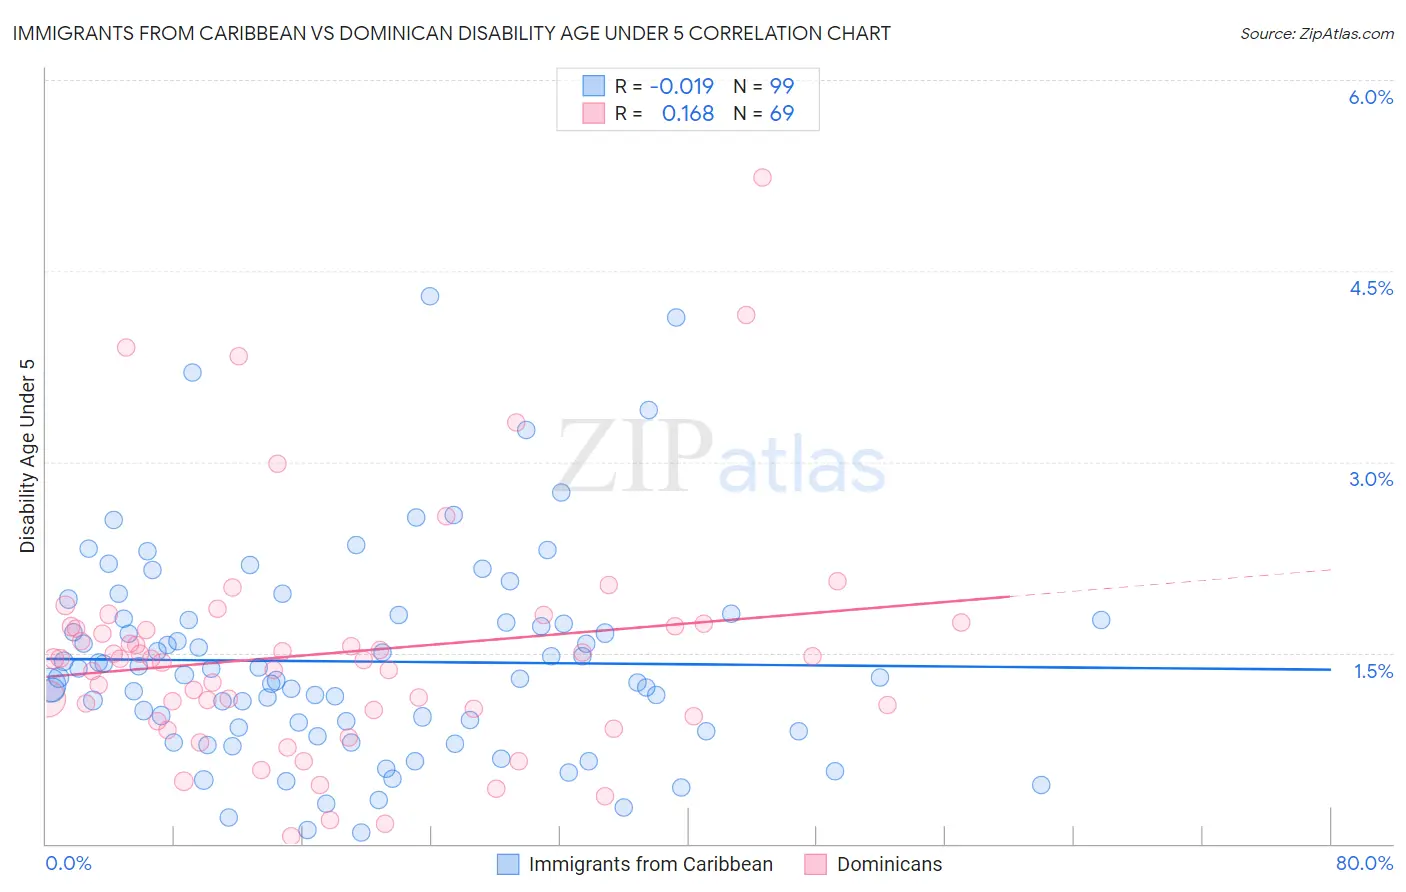
Immigrants from Caribbean vs Dominican Disability Age Under 5 Correlation Chart
The statistical analysis conducted on geographies consisting of 233,002,612 people shows no correlation between the proportion of Immigrants from Caribbean and percentage of population with a disability under the age of 5 in the United States with a correlation coefficient (R) of -0.019 and weighted average of 1.2%. Similarly, the statistical analysis conducted on geographies consisting of 197,745,211 people shows a poor positive correlation between the proportion of Dominicans and percentage of population with a disability under the age of 5 in the United States with a correlation coefficient (R) of 0.168 and weighted average of 1.1%, a difference of 1.3%.
Disability Age Under 5 Correlation Summary
| Measurement | Immigrants from Caribbean | Dominican |
| Minimum | 0.090% | 0.058% |
| Maximum | 4.3% | 5.2% |
| Range | 4.2% | 5.2% |
| Mean | 1.4% | 1.5% |
| Median | 1.3% | 1.5% |
| Interquartile 25% (IQ1) | 0.88% | 1.0% |
| Interquartile 75% (IQ3) | 1.8% | 1.7% |
| Interquartile Range (IQR) | 0.88% | 0.68% |
| Standard Deviation (Sample) | 0.81% | 0.92% |
| Standard Deviation (Population) | 0.80% | 0.91% |
Demographics Similar to Immigrants from Caribbean and Dominicans by Disability Age Under 5
In terms of disability age under 5, the demographic groups most similar to Immigrants from Caribbean are Belizean (1.2%, a difference of 0.010%), Immigrants from Northern Africa (1.2%, a difference of 0.020%), Immigrants from Philippines (1.2%, a difference of 0.15%), Immigrants from Oceania (1.2%, a difference of 0.16%), and Immigrants from Australia (1.2%, a difference of 0.22%). Similarly, the demographic groups most similar to Dominicans are Nicaraguan (1.1%, a difference of 0.030%), Immigrants from South Eastern Asia (1.1%, a difference of 0.13%), Immigrants from Iraq (1.1%, a difference of 0.14%), Immigrants from Uganda (1.1%, a difference of 0.14%), and Immigrants from Morocco (1.2%, a difference of 0.20%).
| Demographics | Rating | Rank | Disability Age Under 5 |
| Immigrants | Iraq | 96.5 /100 | #97 | Exceptional 1.1% |
| Immigrants | South Eastern Asia | 96.5 /100 | #98 | Exceptional 1.1% |
| Dominicans | 96.3 /100 | #99 | Exceptional 1.1% |
| Nicaraguans | 96.3 /100 | #100 | Exceptional 1.1% |
| Immigrants | Uganda | 96.1 /100 | #101 | Exceptional 1.1% |
| Immigrants | Morocco | 96.0 /100 | #102 | Exceptional 1.2% |
| Immigrants | Nicaragua | 96.0 /100 | #103 | Exceptional 1.2% |
| Indonesians | 95.9 /100 | #104 | Exceptional 1.2% |
| Immigrants | South Africa | 95.6 /100 | #105 | Exceptional 1.2% |
| Cambodians | 95.4 /100 | #106 | Exceptional 1.2% |
| Immigrants | West Indies | 95.3 /100 | #107 | Exceptional 1.2% |
| Iraqis | 95.1 /100 | #108 | Exceptional 1.2% |
| Immigrants | Panama | 95.0 /100 | #109 | Exceptional 1.2% |
| Immigrants | Lebanon | 95.0 /100 | #110 | Exceptional 1.2% |
| Senegalese | 94.6 /100 | #111 | Exceptional 1.2% |
| Immigrants | Australia | 94.4 /100 | #112 | Exceptional 1.2% |
| Immigrants | Oceania | 94.2 /100 | #113 | Exceptional 1.2% |
| Belizeans | 93.9 /100 | #114 | Exceptional 1.2% |
| Immigrants | Caribbean | 93.8 /100 | #115 | Exceptional 1.2% |
| Immigrants | Northern Africa | 93.8 /100 | #116 | Exceptional 1.2% |
| Immigrants | Philippines | 93.5 /100 | #117 | Exceptional 1.2% |