Immigrants from Caribbean vs Sioux Disability Age Under 5
COMPARE
Immigrants from Caribbean
Sioux
Disability Age Under 5
Disability Age Under 5 Comparison
Immigrants from Caribbean
Sioux
1.2%
DISABILITY AGE UNDER 5
93.8/ 100
METRIC RATING
115th/ 347
METRIC RANK
1.8%
DISABILITY AGE UNDER 5
0.0/ 100
METRIC RATING
326th/ 347
METRIC RANK
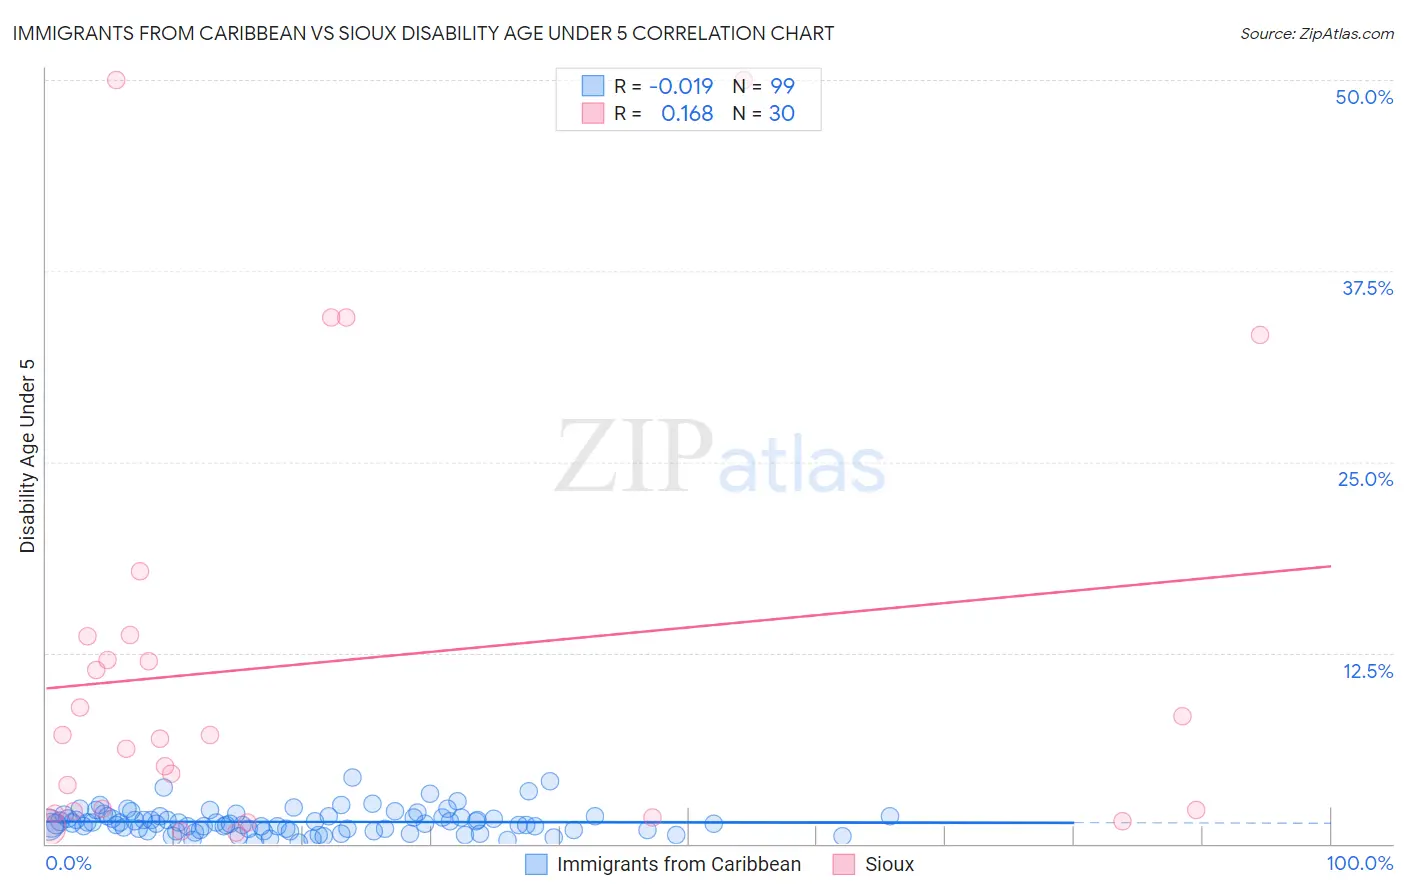
Immigrants from Caribbean vs Sioux Disability Age Under 5 Correlation Chart
The statistical analysis conducted on geographies consisting of 233,002,612 people shows no correlation between the proportion of Immigrants from Caribbean and percentage of population with a disability under the age of 5 in the United States with a correlation coefficient (R) of -0.019 and weighted average of 1.2%. Similarly, the statistical analysis conducted on geographies consisting of 151,129,395 people shows a poor positive correlation between the proportion of Sioux and percentage of population with a disability under the age of 5 in the United States with a correlation coefficient (R) of 0.168 and weighted average of 1.8%, a difference of 56.4%.
Disability Age Under 5 Correlation Summary
| Measurement | Immigrants from Caribbean | Sioux |
| Minimum | 0.090% | 0.72% |
| Maximum | 4.3% | 50.0% |
| Range | 4.2% | 49.3% |
| Mean | 1.4% | 11.9% |
| Median | 1.3% | 7.0% |
| Interquartile 25% (IQ1) | 0.88% | 2.1% |
| Interquartile 75% (IQ3) | 1.8% | 13.6% |
| Interquartile Range (IQR) | 0.88% | 11.5% |
| Standard Deviation (Sample) | 0.81% | 14.1% |
| Standard Deviation (Population) | 0.80% | 13.9% |
Similar Demographics by Disability Age Under 5
Demographics Similar to Immigrants from Caribbean by Disability Age Under 5
In terms of disability age under 5, the demographic groups most similar to Immigrants from Caribbean are Belizean (1.2%, a difference of 0.010%), Immigrants from Northern Africa (1.2%, a difference of 0.020%), Immigrants from Philippines (1.2%, a difference of 0.15%), Immigrants from Oceania (1.2%, a difference of 0.16%), and Immigrants from Venezuela (1.2%, a difference of 0.19%).
| Demographics | Rating | Rank | Disability Age Under 5 |
| Iraqis | 95.1 /100 | #108 | Exceptional 1.2% |
| Immigrants | Panama | 95.0 /100 | #109 | Exceptional 1.2% |
| Immigrants | Lebanon | 95.0 /100 | #110 | Exceptional 1.2% |
| Senegalese | 94.6 /100 | #111 | Exceptional 1.2% |
| Immigrants | Australia | 94.4 /100 | #112 | Exceptional 1.2% |
| Immigrants | Oceania | 94.2 /100 | #113 | Exceptional 1.2% |
| Belizeans | 93.9 /100 | #114 | Exceptional 1.2% |
| Immigrants | Caribbean | 93.8 /100 | #115 | Exceptional 1.2% |
| Immigrants | Northern Africa | 93.8 /100 | #116 | Exceptional 1.2% |
| Immigrants | Philippines | 93.5 /100 | #117 | Exceptional 1.2% |
| Immigrants | Venezuela | 93.4 /100 | #118 | Exceptional 1.2% |
| Bhutanese | 92.5 /100 | #119 | Exceptional 1.2% |
| Immigrants | Eritrea | 92.3 /100 | #120 | Exceptional 1.2% |
| Immigrants | Senegal | 91.4 /100 | #121 | Exceptional 1.2% |
| Aleuts | 90.7 /100 | #122 | Exceptional 1.2% |
Demographics Similar to Sioux by Disability Age Under 5
In terms of disability age under 5, the demographic groups most similar to Sioux are Osage (1.8%, a difference of 0.39%), Immigrants from Portugal (1.8%, a difference of 1.4%), American (1.9%, a difference of 2.1%), Houma (1.9%, a difference of 2.6%), and Cherokee (1.8%, a difference of 2.8%).
| Demographics | Rating | Rank | Disability Age Under 5 |
| Slovaks | 0.0 /100 | #319 | Tragic 1.7% |
| Scotch-Irish | 0.0 /100 | #320 | Tragic 1.7% |
| Ottawa | 0.0 /100 | #321 | Tragic 1.7% |
| Germans | 0.0 /100 | #322 | Tragic 1.7% |
| Chickasaw | 0.0 /100 | #323 | Tragic 1.7% |
| Cherokee | 0.0 /100 | #324 | Tragic 1.8% |
| Immigrants | Portugal | 0.0 /100 | #325 | Tragic 1.8% |
| Sioux | 0.0 /100 | #326 | Tragic 1.8% |
| Osage | 0.0 /100 | #327 | Tragic 1.8% |
| Americans | 0.0 /100 | #328 | Tragic 1.9% |
| Houma | 0.0 /100 | #329 | Tragic 1.9% |
| Choctaw | 0.0 /100 | #330 | Tragic 1.9% |
| French Canadians | 0.0 /100 | #331 | Tragic 1.9% |
| Chippewa | 0.0 /100 | #332 | Tragic 1.9% |
| Dutch West Indians | 0.0 /100 | #333 | Tragic 1.9% |