Immigrants from Burma/Myanmar vs Choctaw Births to Unmarried Women
COMPARE
Immigrants from Burma/Myanmar
Choctaw
Births to Unmarried Women
Births to Unmarried Women Comparison
Immigrants from Burma/Myanmar
Choctaw
32.9%
BIRTHS TO UNMARRIED WOMEN
16.7/ 100
METRIC RATING
201st/ 347
METRIC RANK
36.9%
BIRTHS TO UNMARRIED WOMEN
0.1/ 100
METRIC RATING
272nd/ 347
METRIC RANK
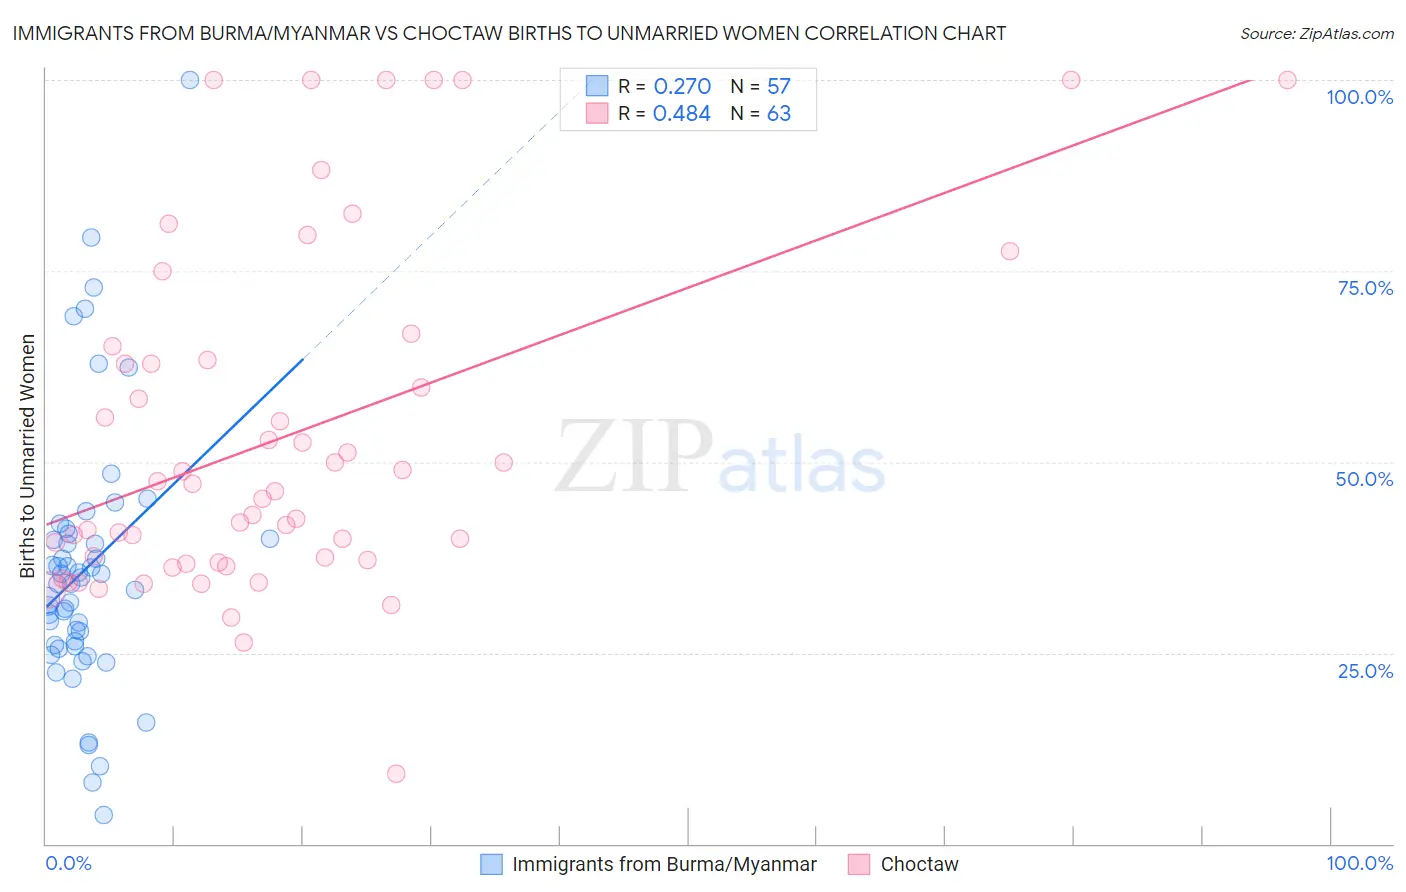
Immigrants from Burma/Myanmar vs Choctaw Births to Unmarried Women Correlation Chart
The statistical analysis conducted on geographies consisting of 166,895,809 people shows a weak positive correlation between the proportion of Immigrants from Burma/Myanmar and percentage of births to unmarried women in the United States with a correlation coefficient (R) of 0.270 and weighted average of 32.9%. Similarly, the statistical analysis conducted on geographies consisting of 258,635,203 people shows a moderate positive correlation between the proportion of Choctaw and percentage of births to unmarried women in the United States with a correlation coefficient (R) of 0.484 and weighted average of 36.9%, a difference of 12.2%.
Births to Unmarried Women Correlation Summary
| Measurement | Immigrants from Burma/Myanmar | Choctaw |
| Minimum | 3.8% | 9.1% |
| Maximum | 100.0% | 100.0% |
| Range | 96.2% | 90.9% |
| Mean | 36.0% | 53.2% |
| Median | 34.0% | 46.2% |
| Interquartile 25% (IQ1) | 25.9% | 36.9% |
| Interquartile 75% (IQ3) | 40.3% | 63.4% |
| Interquartile Range (IQR) | 14.4% | 26.5% |
| Standard Deviation (Sample) | 17.5% | 22.4% |
| Standard Deviation (Population) | 17.4% | 22.2% |
Similar Demographics by Births to Unmarried Women
Demographics Similar to Immigrants from Burma/Myanmar by Births to Unmarried Women
In terms of births to unmarried women, the demographic groups most similar to Immigrants from Burma/Myanmar are Immigrants from Micronesia (32.9%, a difference of 0.010%), Immigrants from Germany (32.8%, a difference of 0.33%), Immigrants from Thailand (32.8%, a difference of 0.34%), Ute (33.0%, a difference of 0.39%), and Immigrants from Africa (33.0%, a difference of 0.41%).
| Demographics | Rating | Rank | Births to Unmarried Women |
| Sudanese | 27.3 /100 | #194 | Fair 32.4% |
| Samoans | 21.9 /100 | #195 | Fair 32.6% |
| Immigrants | Colombia | 21.7 /100 | #196 | Fair 32.6% |
| Immigrants | Immigrants | 20.6 /100 | #197 | Fair 32.7% |
| Costa Ricans | 20.3 /100 | #198 | Fair 32.7% |
| Immigrants | Thailand | 18.9 /100 | #199 | Poor 32.8% |
| Immigrants | Germany | 18.8 /100 | #200 | Poor 32.8% |
| Immigrants | Burma/Myanmar | 16.7 /100 | #201 | Poor 32.9% |
| Immigrants | Micronesia | 16.6 /100 | #202 | Poor 32.9% |
| Ute | 14.4 /100 | #203 | Poor 33.0% |
| Immigrants | Africa | 14.3 /100 | #204 | Poor 33.0% |
| German Russians | 13.1 /100 | #205 | Poor 33.1% |
| Uruguayans | 12.8 /100 | #206 | Poor 33.1% |
| Immigrants | Sudan | 11.5 /100 | #207 | Poor 33.2% |
| Hawaiians | 11.3 /100 | #208 | Poor 33.2% |
Demographics Similar to Choctaw by Births to Unmarried Women
In terms of births to unmarried women, the demographic groups most similar to Choctaw are Mexican (36.9%, a difference of 0.12%), Cree (37.0%, a difference of 0.21%), Immigrants from Barbados (36.8%, a difference of 0.22%), Barbadian (37.0%, a difference of 0.23%), and Immigrants from Congo (36.8%, a difference of 0.24%).
| Demographics | Rating | Rank | Births to Unmarried Women |
| Cherokee | 0.1 /100 | #265 | Tragic 36.7% |
| Immigrants | Senegal | 0.1 /100 | #266 | Tragic 36.7% |
| Central Americans | 0.1 /100 | #267 | Tragic 36.7% |
| Comanche | 0.1 /100 | #268 | Tragic 36.7% |
| Senegalese | 0.1 /100 | #269 | Tragic 36.8% |
| Immigrants | Congo | 0.1 /100 | #270 | Tragic 36.8% |
| Immigrants | Barbados | 0.1 /100 | #271 | Tragic 36.8% |
| Choctaw | 0.1 /100 | #272 | Tragic 36.9% |
| Mexicans | 0.1 /100 | #273 | Tragic 36.9% |
| Cree | 0.1 /100 | #274 | Tragic 37.0% |
| Barbadians | 0.1 /100 | #275 | Tragic 37.0% |
| Belizeans | 0.1 /100 | #276 | Tragic 37.0% |
| Guatemalans | 0.1 /100 | #277 | Tragic 37.1% |
| Immigrants | Latin America | 0.1 /100 | #278 | Tragic 37.1% |
| West Indians | 0.1 /100 | #279 | Tragic 37.3% |