Immigrants from Nigeria vs Choctaw Disability Age Over 75
COMPARE
Immigrants from Nigeria
Choctaw
Disability Age Over 75
Disability Age Over 75 Comparison
Immigrants from Nigeria
Choctaw
47.5%
DISABILITY AGE OVER 75
34.0/ 100
METRIC RATING
184th/ 347
METRIC RANK
52.7%
DISABILITY AGE OVER 75
0.0/ 100
METRIC RATING
328th/ 347
METRIC RANK
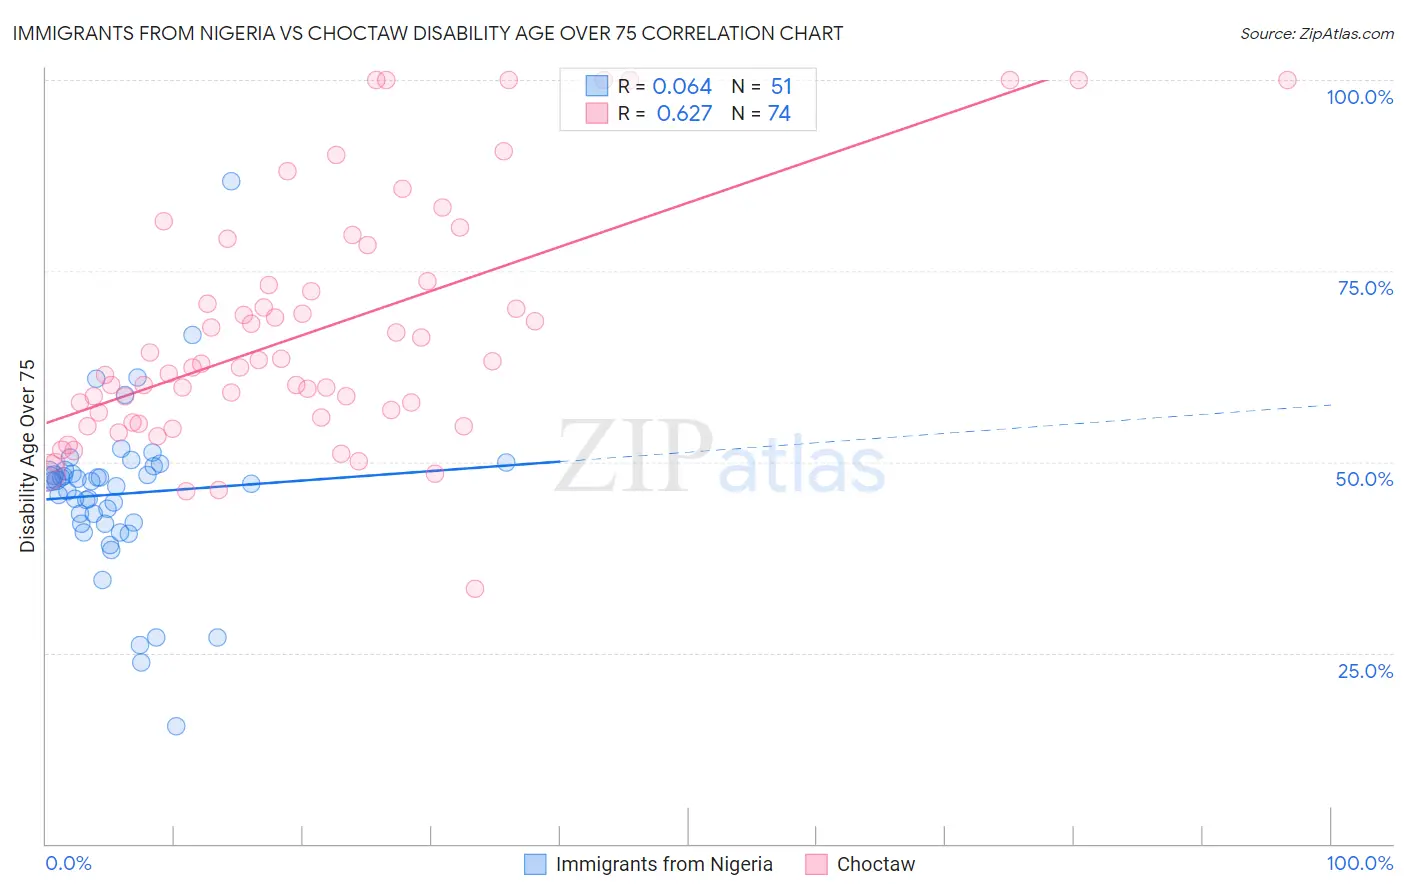
Immigrants from Nigeria vs Choctaw Disability Age Over 75 Correlation Chart
The statistical analysis conducted on geographies consisting of 283,030,809 people shows a slight positive correlation between the proportion of Immigrants from Nigeria and percentage of population with a disability over the age of 75 in the United States with a correlation coefficient (R) of 0.064 and weighted average of 47.5%. Similarly, the statistical analysis conducted on geographies consisting of 269,353,034 people shows a significant positive correlation between the proportion of Choctaw and percentage of population with a disability over the age of 75 in the United States with a correlation coefficient (R) of 0.627 and weighted average of 52.7%, a difference of 10.9%.
Disability Age Over 75 Correlation Summary
| Measurement | Immigrants from Nigeria | Choctaw |
| Minimum | 15.5% | 33.3% |
| Maximum | 86.8% | 100.0% |
| Range | 71.3% | 66.7% |
| Mean | 45.8% | 67.1% |
| Median | 47.5% | 62.6% |
| Interquartile 25% (IQ1) | 42.0% | 55.9% |
| Interquartile 75% (IQ3) | 48.9% | 73.7% |
| Interquartile Range (IQR) | 6.9% | 17.8% |
| Standard Deviation (Sample) | 10.8% | 15.9% |
| Standard Deviation (Population) | 10.7% | 15.8% |
Similar Demographics by Disability Age Over 75
Demographics Similar to Immigrants from Nigeria by Disability Age Over 75
In terms of disability age over 75, the demographic groups most similar to Immigrants from Nigeria are Ghanaian (47.5%, a difference of 0.030%), Sudanese (47.5%, a difference of 0.050%), Immigrants from Sudan (47.5%, a difference of 0.060%), Basque (47.6%, a difference of 0.080%), and Immigrants from Kenya (47.6%, a difference of 0.080%).
| Demographics | Rating | Rank | Disability Age Over 75 |
| Haitians | 44.6 /100 | #177 | Average 47.4% |
| Cubans | 42.1 /100 | #178 | Average 47.4% |
| Sierra Leoneans | 41.7 /100 | #179 | Average 47.4% |
| Immigrants | Ecuador | 41.7 /100 | #180 | Average 47.4% |
| Immigrants | Kazakhstan | 40.4 /100 | #181 | Average 47.4% |
| Immigrants | Moldova | 39.9 /100 | #182 | Fair 47.4% |
| Delaware | 39.1 /100 | #183 | Fair 47.5% |
| Immigrants | Nigeria | 34.0 /100 | #184 | Fair 47.5% |
| Ghanaians | 33.0 /100 | #185 | Fair 47.5% |
| Sudanese | 32.0 /100 | #186 | Fair 47.5% |
| Immigrants | Sudan | 31.8 /100 | #187 | Fair 47.5% |
| Basques | 30.9 /100 | #188 | Fair 47.6% |
| Immigrants | Kenya | 30.8 /100 | #189 | Fair 47.6% |
| Somalis | 29.5 /100 | #190 | Fair 47.6% |
| Portuguese | 29.3 /100 | #191 | Fair 47.6% |
Demographics Similar to Choctaw by Disability Age Over 75
In terms of disability age over 75, the demographic groups most similar to Choctaw are Nepalese (52.6%, a difference of 0.19%), Ute (52.6%, a difference of 0.22%), Alaska Native (52.8%, a difference of 0.22%), Puerto Rican (52.9%, a difference of 0.39%), and Hopi (52.9%, a difference of 0.41%).
| Demographics | Rating | Rank | Disability Age Over 75 |
| Dutch West Indians | 0.0 /100 | #321 | Tragic 51.5% |
| Comanche | 0.0 /100 | #322 | Tragic 51.7% |
| Immigrants | Yemen | 0.0 /100 | #323 | Tragic 52.0% |
| Menominee | 0.0 /100 | #324 | Tragic 52.3% |
| Immigrants | Cabo Verde | 0.0 /100 | #325 | Tragic 52.4% |
| Ute | 0.0 /100 | #326 | Tragic 52.6% |
| Nepalese | 0.0 /100 | #327 | Tragic 52.6% |
| Choctaw | 0.0 /100 | #328 | Tragic 52.7% |
| Alaska Natives | 0.0 /100 | #329 | Tragic 52.8% |
| Puerto Ricans | 0.0 /100 | #330 | Tragic 52.9% |
| Hopi | 0.0 /100 | #331 | Tragic 52.9% |
| Natives/Alaskans | 0.0 /100 | #332 | Tragic 53.1% |
| Apache | 0.0 /100 | #333 | Tragic 53.6% |
| Alaskan Athabascans | 0.0 /100 | #334 | Tragic 54.0% |
| Kiowa | 0.0 /100 | #335 | Tragic 54.2% |