Zimbabwean vs Choctaw Disability Age Over 75
COMPARE
Zimbabwean
Choctaw
Disability Age Over 75
Disability Age Over 75 Comparison
Zimbabweans
Choctaw
48.1%
DISABILITY AGE OVER 75
6.4/ 100
METRIC RATING
227th/ 347
METRIC RANK
52.7%
DISABILITY AGE OVER 75
0.0/ 100
METRIC RATING
328th/ 347
METRIC RANK
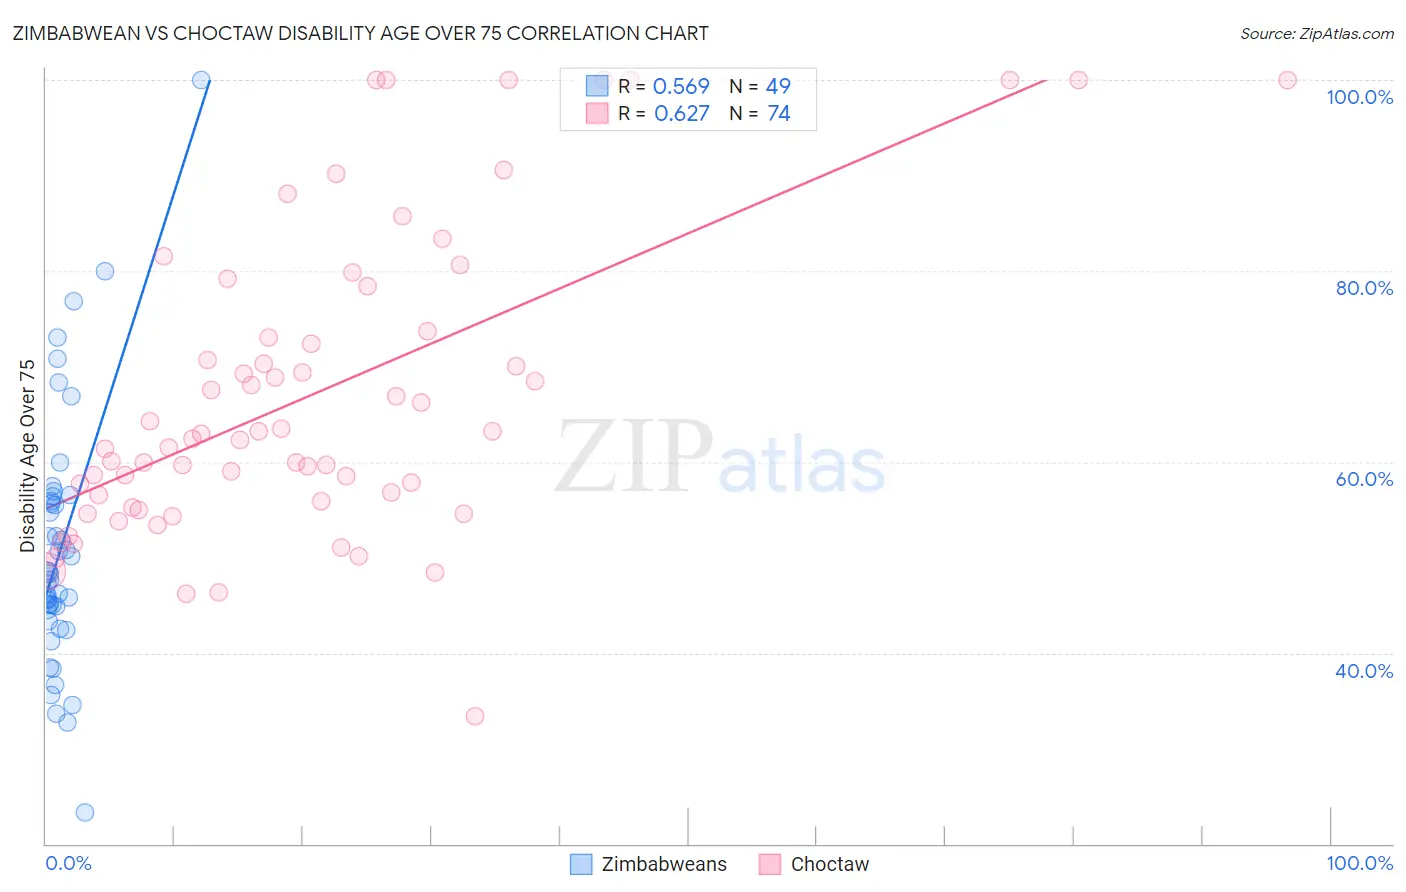
Zimbabwean vs Choctaw Disability Age Over 75 Correlation Chart
The statistical analysis conducted on geographies consisting of 69,112,406 people shows a substantial positive correlation between the proportion of Zimbabweans and percentage of population with a disability over the age of 75 in the United States with a correlation coefficient (R) of 0.569 and weighted average of 48.1%. Similarly, the statistical analysis conducted on geographies consisting of 269,353,034 people shows a significant positive correlation between the proportion of Choctaw and percentage of population with a disability over the age of 75 in the United States with a correlation coefficient (R) of 0.627 and weighted average of 52.7%, a difference of 9.6%.
Disability Age Over 75 Correlation Summary
| Measurement | Zimbabwean | Choctaw |
| Minimum | 23.2% | 33.3% |
| Maximum | 100.0% | 100.0% |
| Range | 76.8% | 66.7% |
| Mean | 50.8% | 67.1% |
| Median | 48.2% | 62.6% |
| Interquartile 25% (IQ1) | 43.9% | 55.9% |
| Interquartile 75% (IQ3) | 56.1% | 73.7% |
| Interquartile Range (IQR) | 12.3% | 17.8% |
| Standard Deviation (Sample) | 13.5% | 15.9% |
| Standard Deviation (Population) | 13.4% | 15.8% |
Similar Demographics by Disability Age Over 75
Demographics Similar to Zimbabweans by Disability Age Over 75
In terms of disability age over 75, the demographic groups most similar to Zimbabweans are Spanish (48.0%, a difference of 0.010%), Nonimmigrants (48.0%, a difference of 0.010%), Liberian (48.0%, a difference of 0.020%), Immigrants from Bangladesh (48.0%, a difference of 0.030%), and Barbadian (48.0%, a difference of 0.040%).
| Demographics | Rating | Rank | Disability Age Over 75 |
| Bahamians | 7.4 /100 | #220 | Tragic 48.0% |
| Immigrants | Oceania | 7.3 /100 | #221 | Tragic 48.0% |
| Barbadians | 6.8 /100 | #222 | Tragic 48.0% |
| Immigrants | Bangladesh | 6.8 /100 | #223 | Tragic 48.0% |
| Liberians | 6.7 /100 | #224 | Tragic 48.0% |
| Spanish | 6.5 /100 | #225 | Tragic 48.0% |
| Immigrants | Nonimmigrants | 6.5 /100 | #226 | Tragic 48.0% |
| Zimbabweans | 6.4 /100 | #227 | Tragic 48.1% |
| Immigrants | Liberia | 5.9 /100 | #228 | Tragic 48.1% |
| Spaniards | 5.7 /100 | #229 | Tragic 48.1% |
| Taiwanese | 4.4 /100 | #230 | Tragic 48.2% |
| Immigrants | Immigrants | 4.3 /100 | #231 | Tragic 48.2% |
| Indonesians | 4.2 /100 | #232 | Tragic 48.2% |
| Cree | 4.2 /100 | #233 | Tragic 48.2% |
| Sub-Saharan Africans | 3.8 /100 | #234 | Tragic 48.2% |
Demographics Similar to Choctaw by Disability Age Over 75
In terms of disability age over 75, the demographic groups most similar to Choctaw are Nepalese (52.6%, a difference of 0.19%), Ute (52.6%, a difference of 0.22%), Alaska Native (52.8%, a difference of 0.22%), Puerto Rican (52.9%, a difference of 0.39%), and Hopi (52.9%, a difference of 0.41%).
| Demographics | Rating | Rank | Disability Age Over 75 |
| Dutch West Indians | 0.0 /100 | #321 | Tragic 51.5% |
| Comanche | 0.0 /100 | #322 | Tragic 51.7% |
| Immigrants | Yemen | 0.0 /100 | #323 | Tragic 52.0% |
| Menominee | 0.0 /100 | #324 | Tragic 52.3% |
| Immigrants | Cabo Verde | 0.0 /100 | #325 | Tragic 52.4% |
| Ute | 0.0 /100 | #326 | Tragic 52.6% |
| Nepalese | 0.0 /100 | #327 | Tragic 52.6% |
| Choctaw | 0.0 /100 | #328 | Tragic 52.7% |
| Alaska Natives | 0.0 /100 | #329 | Tragic 52.8% |
| Puerto Ricans | 0.0 /100 | #330 | Tragic 52.9% |
| Hopi | 0.0 /100 | #331 | Tragic 52.9% |
| Natives/Alaskans | 0.0 /100 | #332 | Tragic 53.1% |
| Apache | 0.0 /100 | #333 | Tragic 53.6% |
| Alaskan Athabascans | 0.0 /100 | #334 | Tragic 54.0% |
| Kiowa | 0.0 /100 | #335 | Tragic 54.2% |