Yakama vs Choctaw Disability Age Over 75
COMPARE
Yakama
Choctaw
Disability Age Over 75
Disability Age Over 75 Comparison
Yakama
Choctaw
51.3%
DISABILITY AGE OVER 75
0.0/ 100
METRIC RATING
317th/ 347
METRIC RANK
52.7%
DISABILITY AGE OVER 75
0.0/ 100
METRIC RATING
328th/ 347
METRIC RANK
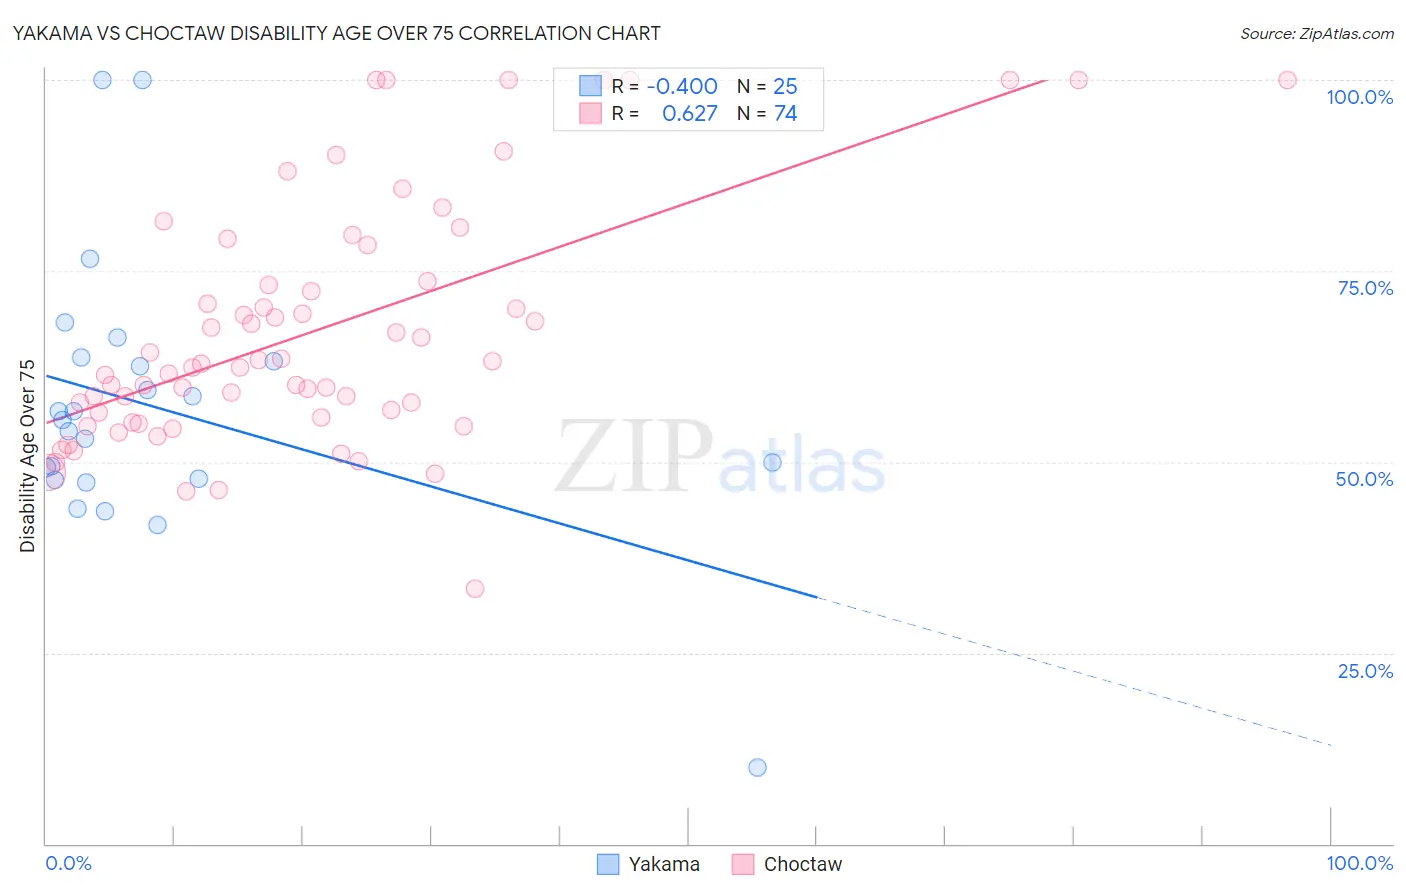
Yakama vs Choctaw Disability Age Over 75 Correlation Chart
The statistical analysis conducted on geographies consisting of 19,911,140 people shows a moderate negative correlation between the proportion of Yakama and percentage of population with a disability over the age of 75 in the United States with a correlation coefficient (R) of -0.400 and weighted average of 51.3%. Similarly, the statistical analysis conducted on geographies consisting of 269,353,034 people shows a significant positive correlation between the proportion of Choctaw and percentage of population with a disability over the age of 75 in the United States with a correlation coefficient (R) of 0.627 and weighted average of 52.7%, a difference of 2.7%.
Disability Age Over 75 Correlation Summary
| Measurement | Yakama | Choctaw |
| Minimum | 10.0% | 33.3% |
| Maximum | 100.0% | 100.0% |
| Range | 90.0% | 66.7% |
| Mean | 57.0% | 67.1% |
| Median | 55.5% | 62.6% |
| Interquartile 25% (IQ1) | 47.8% | 55.9% |
| Interquartile 75% (IQ3) | 63.4% | 73.7% |
| Interquartile Range (IQR) | 15.6% | 17.8% |
| Standard Deviation (Sample) | 17.9% | 15.9% |
| Standard Deviation (Population) | 17.5% | 15.8% |
Demographics Similar to Yakama and Choctaw by Disability Age Over 75
In terms of disability age over 75, the demographic groups most similar to Yakama are Chickasaw (51.2%, a difference of 0.18%), Mexican (51.1%, a difference of 0.32%), Seminole (51.5%, a difference of 0.33%), Creek (51.5%, a difference of 0.33%), and Immigrants from Mexico (51.1%, a difference of 0.37%). Similarly, the demographic groups most similar to Choctaw are Nepalese (52.6%, a difference of 0.19%), Ute (52.6%, a difference of 0.22%), Alaska Native (52.8%, a difference of 0.22%), Puerto Rican (52.9%, a difference of 0.39%), and Hopi (52.9%, a difference of 0.41%).
| Demographics | Rating | Rank | Disability Age Over 75 |
| Cheyenne | 0.0 /100 | #312 | Tragic 50.9% |
| Immigrants | Azores | 0.0 /100 | #313 | Tragic 50.9% |
| Immigrants | Mexico | 0.0 /100 | #314 | Tragic 51.1% |
| Mexicans | 0.0 /100 | #315 | Tragic 51.1% |
| Chickasaw | 0.0 /100 | #316 | Tragic 51.2% |
| Yakama | 0.0 /100 | #317 | Tragic 51.3% |
| Seminole | 0.0 /100 | #318 | Tragic 51.5% |
| Creek | 0.0 /100 | #319 | Tragic 51.5% |
| Paiute | 0.0 /100 | #320 | Tragic 51.5% |
| Dutch West Indians | 0.0 /100 | #321 | Tragic 51.5% |
| Comanche | 0.0 /100 | #322 | Tragic 51.7% |
| Immigrants | Yemen | 0.0 /100 | #323 | Tragic 52.0% |
| Menominee | 0.0 /100 | #324 | Tragic 52.3% |
| Immigrants | Cabo Verde | 0.0 /100 | #325 | Tragic 52.4% |
| Ute | 0.0 /100 | #326 | Tragic 52.6% |
| Nepalese | 0.0 /100 | #327 | Tragic 52.6% |
| Choctaw | 0.0 /100 | #328 | Tragic 52.7% |
| Alaska Natives | 0.0 /100 | #329 | Tragic 52.8% |
| Puerto Ricans | 0.0 /100 | #330 | Tragic 52.9% |
| Hopi | 0.0 /100 | #331 | Tragic 52.9% |
| Natives/Alaskans | 0.0 /100 | #332 | Tragic 53.1% |