Hopi vs Immigrants from Greece Disability Age 5 to 17
COMPARE
Hopi
Immigrants from Greece
Disability Age 5 to 17
Disability Age 5 to 17 Comparison
Hopi
Immigrants from Greece
5.9%
DISABILITY AGE 5 TO 17
1.0/ 100
METRIC RATING
256th/ 347
METRIC RANK
5.2%
DISABILITY AGE 5 TO 17
99.8/ 100
METRIC RATING
65th/ 347
METRIC RANK
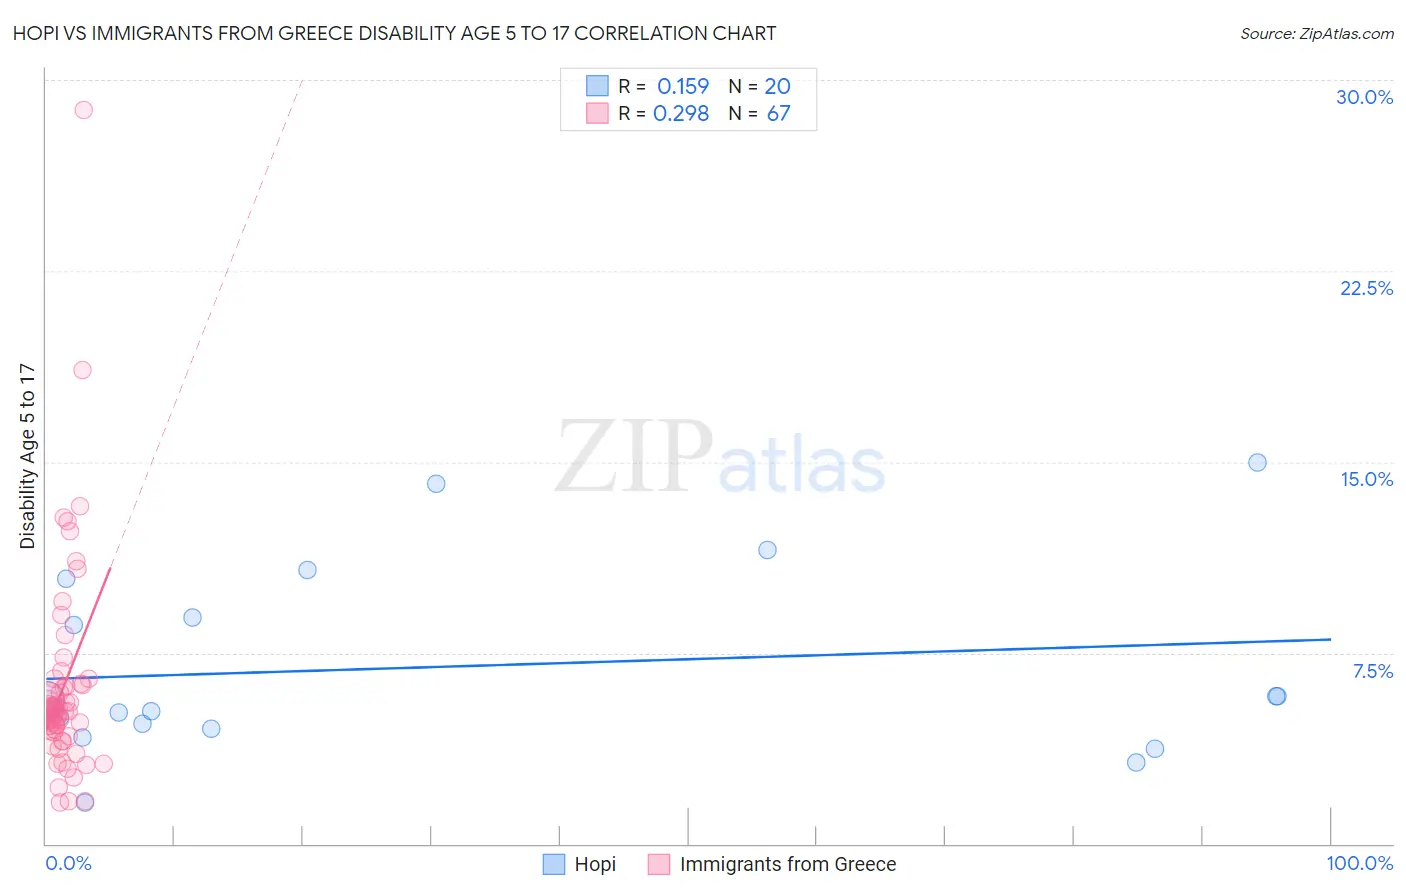
Hopi vs Immigrants from Greece Disability Age 5 to 17 Correlation Chart
The statistical analysis conducted on geographies consisting of 74,609,437 people shows a poor positive correlation between the proportion of Hopi and percentage of population with a disability between the ages 5 and 17 in the United States with a correlation coefficient (R) of 0.159 and weighted average of 5.9%. Similarly, the statistical analysis conducted on geographies consisting of 215,473,396 people shows a weak positive correlation between the proportion of Immigrants from Greece and percentage of population with a disability between the ages 5 and 17 in the United States with a correlation coefficient (R) of 0.298 and weighted average of 5.2%, a difference of 14.3%.
Disability Age 5 to 17 Correlation Summary
| Measurement | Hopi | Immigrants from Greece |
| Minimum | 1.6% | 1.6% |
| Maximum | 15.0% | 28.8% |
| Range | 13.4% | 27.2% |
| Mean | 7.0% | 6.1% |
| Median | 5.5% | 5.2% |
| Interquartile 25% (IQ1) | 4.6% | 4.4% |
| Interquartile 75% (IQ3) | 9.6% | 6.2% |
| Interquartile Range (IQR) | 5.0% | 1.9% |
| Standard Deviation (Sample) | 3.7% | 4.1% |
| Standard Deviation (Population) | 3.6% | 4.1% |
Similar Demographics by Disability Age 5 to 17
Demographics Similar to Hopi by Disability Age 5 to 17
In terms of disability age 5 to 17, the demographic groups most similar to Hopi are Hispanic or Latino (5.9%, a difference of 0.090%), Brazilian (5.9%, a difference of 0.13%), Slavic (5.9%, a difference of 0.18%), Italian (5.9%, a difference of 0.20%), and Barbadian (5.9%, a difference of 0.27%).
| Demographics | Rating | Rank | Disability Age 5 to 17 |
| Immigrants | Ghana | 1.7 /100 | #249 | Tragic 5.9% |
| Poles | 1.5 /100 | #250 | Tragic 5.9% |
| Immigrants | Cambodia | 1.5 /100 | #251 | Tragic 5.9% |
| Hondurans | 1.5 /100 | #252 | Tragic 5.9% |
| Scandinavians | 1.4 /100 | #253 | Tragic 5.9% |
| Barbadians | 1.3 /100 | #254 | Tragic 5.9% |
| Italians | 1.2 /100 | #255 | Tragic 5.9% |
| Hopi | 1.0 /100 | #256 | Tragic 5.9% |
| Hispanics or Latinos | 1.0 /100 | #257 | Tragic 5.9% |
| Brazilians | 0.9 /100 | #258 | Tragic 5.9% |
| Slavs | 0.9 /100 | #259 | Tragic 5.9% |
| Somalis | 0.8 /100 | #260 | Tragic 5.9% |
| Immigrants | Middle Africa | 0.7 /100 | #261 | Tragic 5.9% |
| Immigrants | Western Africa | 0.7 /100 | #262 | Tragic 5.9% |
| Czechoslovakians | 0.7 /100 | #263 | Tragic 5.9% |
Demographics Similar to Immigrants from Greece by Disability Age 5 to 17
In terms of disability age 5 to 17, the demographic groups most similar to Immigrants from Greece are Immigrants from South Eastern Asia (5.2%, a difference of 0.010%), Immigrants from Bangladesh (5.2%, a difference of 0.040%), Palestinian (5.2%, a difference of 0.040%), Macedonian (5.2%, a difference of 0.070%), and Immigrants from Ireland (5.2%, a difference of 0.15%).
| Demographics | Rating | Rank | Disability Age 5 to 17 |
| Immigrants | Ukraine | 99.9 /100 | #58 | Exceptional 5.1% |
| Immigrants | North Macedonia | 99.9 /100 | #59 | Exceptional 5.1% |
| Immigrants | Eastern Europe | 99.9 /100 | #60 | Exceptional 5.1% |
| Immigrants | Switzerland | 99.8 /100 | #61 | Exceptional 5.2% |
| Immigrants | Ireland | 99.8 /100 | #62 | Exceptional 5.2% |
| Immigrants | Bangladesh | 99.8 /100 | #63 | Exceptional 5.2% |
| Immigrants | South Eastern Asia | 99.8 /100 | #64 | Exceptional 5.2% |
| Immigrants | Greece | 99.8 /100 | #65 | Exceptional 5.2% |
| Palestinians | 99.8 /100 | #66 | Exceptional 5.2% |
| Macedonians | 99.8 /100 | #67 | Exceptional 5.2% |
| Immigrants | Syria | 99.7 /100 | #68 | Exceptional 5.2% |
| Guyanese | 99.7 /100 | #69 | Exceptional 5.2% |
| Immigrants | Belgium | 99.7 /100 | #70 | Exceptional 5.2% |
| Jordanians | 99.7 /100 | #71 | Exceptional 5.2% |
| Immigrants | Vietnam | 99.7 /100 | #72 | Exceptional 5.2% |