Hopi vs Inupiat Disability Age 5 to 17
COMPARE
Hopi
Inupiat
Disability Age 5 to 17
Disability Age 5 to 17 Comparison
Hopi
Inupiat
5.9%
DISABILITY AGE 5 TO 17
1.0/ 100
METRIC RATING
256th/ 347
METRIC RANK
5.7%
DISABILITY AGE 5 TO 17
23.3/ 100
METRIC RATING
196th/ 347
METRIC RANK
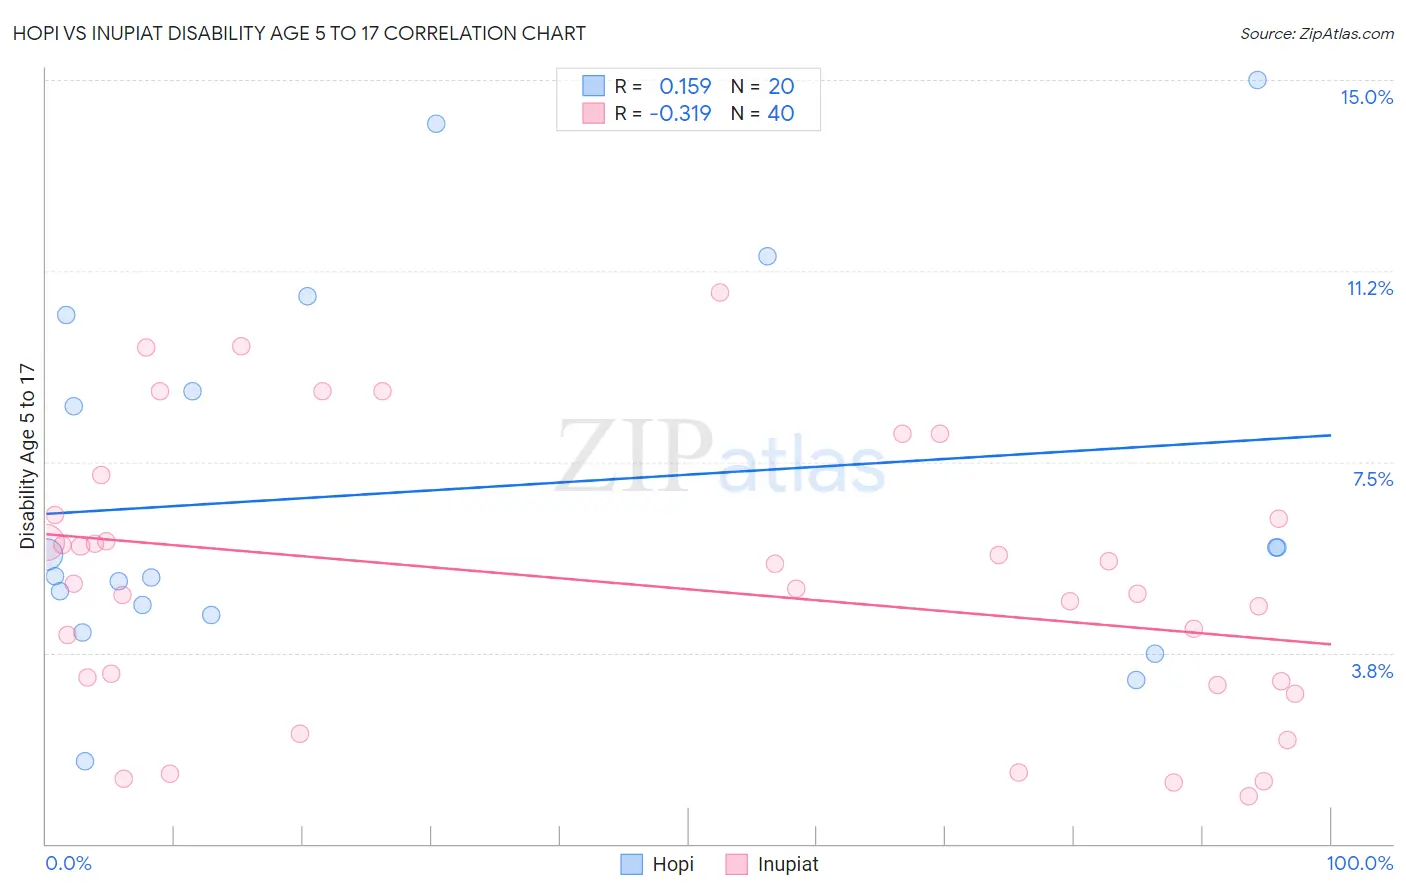
Hopi vs Inupiat Disability Age 5 to 17 Correlation Chart
The statistical analysis conducted on geographies consisting of 74,609,437 people shows a poor positive correlation between the proportion of Hopi and percentage of population with a disability between the ages 5 and 17 in the United States with a correlation coefficient (R) of 0.159 and weighted average of 5.9%. Similarly, the statistical analysis conducted on geographies consisting of 96,104,809 people shows a mild negative correlation between the proportion of Inupiat and percentage of population with a disability between the ages 5 and 17 in the United States with a correlation coefficient (R) of -0.319 and weighted average of 5.7%, a difference of 4.1%.
Disability Age 5 to 17 Correlation Summary
| Measurement | Hopi | Inupiat |
| Minimum | 1.6% | 0.93% |
| Maximum | 15.0% | 10.8% |
| Range | 13.4% | 9.9% |
| Mean | 7.0% | 5.1% |
| Median | 5.5% | 5.1% |
| Interquartile 25% (IQ1) | 4.6% | 3.2% |
| Interquartile 75% (IQ3) | 9.6% | 6.4% |
| Interquartile Range (IQR) | 5.0% | 3.3% |
| Standard Deviation (Sample) | 3.7% | 2.7% |
| Standard Deviation (Population) | 3.6% | 2.6% |
Similar Demographics by Disability Age 5 to 17
Demographics Similar to Hopi by Disability Age 5 to 17
In terms of disability age 5 to 17, the demographic groups most similar to Hopi are Hispanic or Latino (5.9%, a difference of 0.090%), Brazilian (5.9%, a difference of 0.13%), Slavic (5.9%, a difference of 0.18%), Italian (5.9%, a difference of 0.20%), and Barbadian (5.9%, a difference of 0.27%).
| Demographics | Rating | Rank | Disability Age 5 to 17 |
| Immigrants | Ghana | 1.7 /100 | #249 | Tragic 5.9% |
| Poles | 1.5 /100 | #250 | Tragic 5.9% |
| Immigrants | Cambodia | 1.5 /100 | #251 | Tragic 5.9% |
| Hondurans | 1.5 /100 | #252 | Tragic 5.9% |
| Scandinavians | 1.4 /100 | #253 | Tragic 5.9% |
| Barbadians | 1.3 /100 | #254 | Tragic 5.9% |
| Italians | 1.2 /100 | #255 | Tragic 5.9% |
| Hopi | 1.0 /100 | #256 | Tragic 5.9% |
| Hispanics or Latinos | 1.0 /100 | #257 | Tragic 5.9% |
| Brazilians | 0.9 /100 | #258 | Tragic 5.9% |
| Slavs | 0.9 /100 | #259 | Tragic 5.9% |
| Somalis | 0.8 /100 | #260 | Tragic 5.9% |
| Immigrants | Middle Africa | 0.7 /100 | #261 | Tragic 5.9% |
| Immigrants | Western Africa | 0.7 /100 | #262 | Tragic 5.9% |
| Czechoslovakians | 0.7 /100 | #263 | Tragic 5.9% |
Demographics Similar to Inupiat by Disability Age 5 to 17
In terms of disability age 5 to 17, the demographic groups most similar to Inupiat are Immigrants from Nigeria (5.7%, a difference of 0.010%), Immigrants from North America (5.7%, a difference of 0.010%), Croatian (5.7%, a difference of 0.020%), Norwegian (5.7%, a difference of 0.17%), and Immigrants from Canada (5.7%, a difference of 0.18%).
| Demographics | Rating | Rank | Disability Age 5 to 17 |
| Pueblo | 27.5 /100 | #189 | Fair 5.7% |
| Immigrants | Eastern Africa | 27.3 /100 | #190 | Fair 5.7% |
| Danes | 26.5 /100 | #191 | Fair 5.7% |
| Immigrants | Bosnia and Herzegovina | 26.3 /100 | #192 | Fair 5.7% |
| Immigrants | Canada | 26.1 /100 | #193 | Fair 5.7% |
| Croatians | 23.6 /100 | #194 | Fair 5.7% |
| Immigrants | Nigeria | 23.4 /100 | #195 | Fair 5.7% |
| Inupiat | 23.3 /100 | #196 | Fair 5.7% |
| Immigrants | North America | 23.1 /100 | #197 | Fair 5.7% |
| Norwegians | 20.9 /100 | #198 | Fair 5.7% |
| Northern Europeans | 15.2 /100 | #199 | Poor 5.7% |
| Icelanders | 14.6 /100 | #200 | Poor 5.7% |
| Basques | 13.7 /100 | #201 | Poor 5.7% |
| Austrians | 13.2 /100 | #202 | Poor 5.7% |
| Spanish American Indians | 12.8 /100 | #203 | Poor 5.7% |