Hopi vs Immigrants from Bulgaria Disability Age 5 to 17
COMPARE
Hopi
Immigrants from Bulgaria
Disability Age 5 to 17
Disability Age 5 to 17 Comparison
Hopi
Immigrants from Bulgaria
5.9%
DISABILITY AGE 5 TO 17
1.0/ 100
METRIC RATING
256th/ 347
METRIC RANK
5.4%
DISABILITY AGE 5 TO 17
94.0/ 100
METRIC RATING
130th/ 347
METRIC RANK
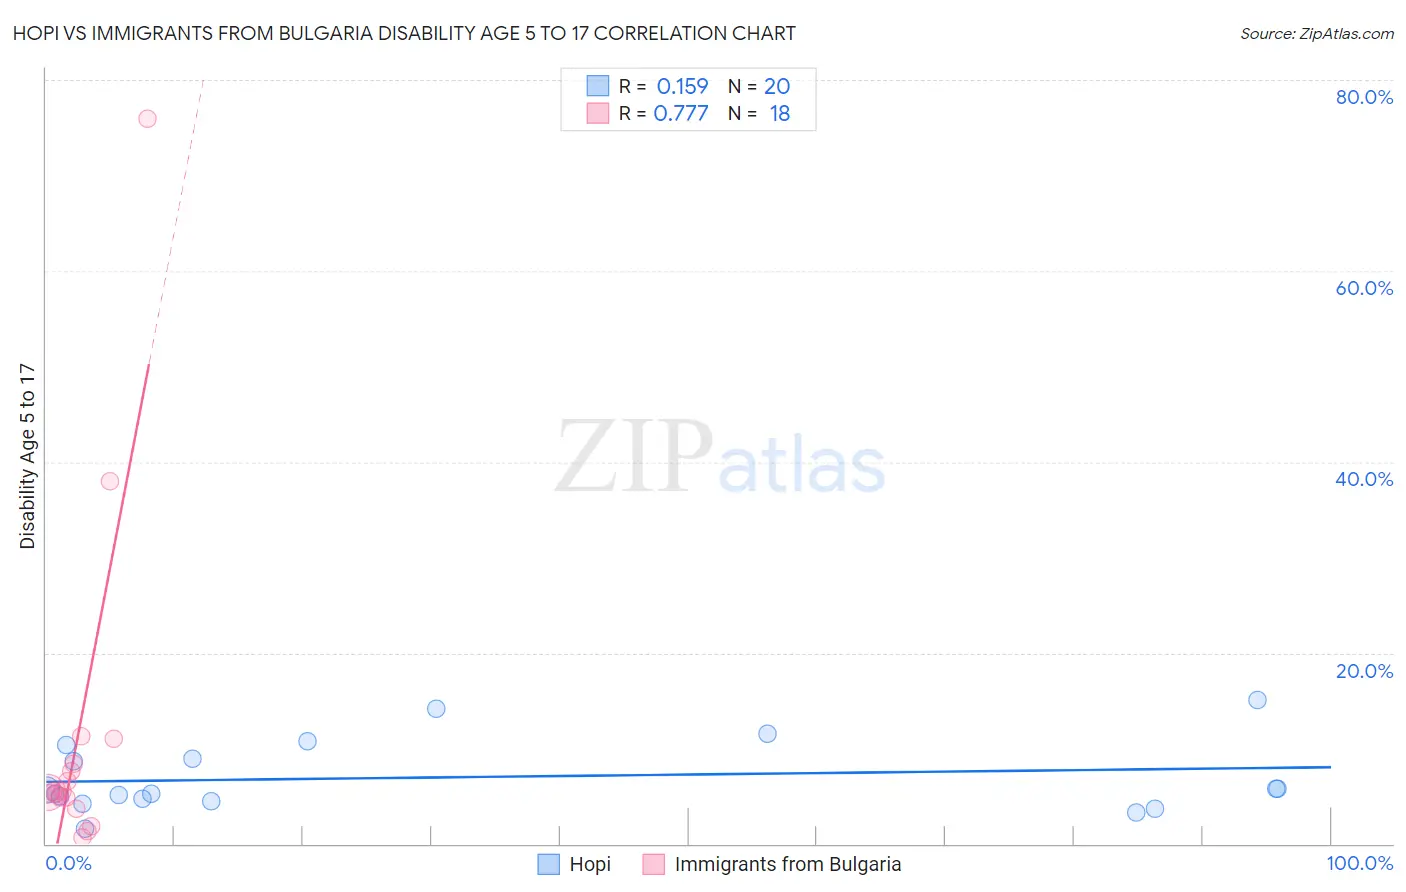
Hopi vs Immigrants from Bulgaria Disability Age 5 to 17 Correlation Chart
The statistical analysis conducted on geographies consisting of 74,609,437 people shows a poor positive correlation between the proportion of Hopi and percentage of population with a disability between the ages 5 and 17 in the United States with a correlation coefficient (R) of 0.159 and weighted average of 5.9%. Similarly, the statistical analysis conducted on geographies consisting of 171,828,354 people shows a strong positive correlation between the proportion of Immigrants from Bulgaria and percentage of population with a disability between the ages 5 and 17 in the United States with a correlation coefficient (R) of 0.777 and weighted average of 5.4%, a difference of 9.4%.
Disability Age 5 to 17 Correlation Summary
| Measurement | Hopi | Immigrants from Bulgaria |
| Minimum | 1.6% | 0.67% |
| Maximum | 15.0% | 76.0% |
| Range | 13.4% | 75.3% |
| Mean | 7.0% | 11.3% |
| Median | 5.5% | 5.4% |
| Interquartile 25% (IQ1) | 4.6% | 4.8% |
| Interquartile 75% (IQ3) | 9.6% | 8.4% |
| Interquartile Range (IQR) | 5.0% | 3.6% |
| Standard Deviation (Sample) | 3.7% | 18.1% |
| Standard Deviation (Population) | 3.6% | 17.6% |
Similar Demographics by Disability Age 5 to 17
Demographics Similar to Hopi by Disability Age 5 to 17
In terms of disability age 5 to 17, the demographic groups most similar to Hopi are Hispanic or Latino (5.9%, a difference of 0.090%), Brazilian (5.9%, a difference of 0.13%), Slavic (5.9%, a difference of 0.18%), Italian (5.9%, a difference of 0.20%), and Barbadian (5.9%, a difference of 0.27%).
| Demographics | Rating | Rank | Disability Age 5 to 17 |
| Immigrants | Ghana | 1.7 /100 | #249 | Tragic 5.9% |
| Poles | 1.5 /100 | #250 | Tragic 5.9% |
| Immigrants | Cambodia | 1.5 /100 | #251 | Tragic 5.9% |
| Hondurans | 1.5 /100 | #252 | Tragic 5.9% |
| Scandinavians | 1.4 /100 | #253 | Tragic 5.9% |
| Barbadians | 1.3 /100 | #254 | Tragic 5.9% |
| Italians | 1.2 /100 | #255 | Tragic 5.9% |
| Hopi | 1.0 /100 | #256 | Tragic 5.9% |
| Hispanics or Latinos | 1.0 /100 | #257 | Tragic 5.9% |
| Brazilians | 0.9 /100 | #258 | Tragic 5.9% |
| Slavs | 0.9 /100 | #259 | Tragic 5.9% |
| Somalis | 0.8 /100 | #260 | Tragic 5.9% |
| Immigrants | Middle Africa | 0.7 /100 | #261 | Tragic 5.9% |
| Immigrants | Western Africa | 0.7 /100 | #262 | Tragic 5.9% |
| Czechoslovakians | 0.7 /100 | #263 | Tragic 5.9% |
Demographics Similar to Immigrants from Bulgaria by Disability Age 5 to 17
In terms of disability age 5 to 17, the demographic groups most similar to Immigrants from Bulgaria are Romanian (5.4%, a difference of 0.020%), Immigrants from Venezuela (5.4%, a difference of 0.11%), New Zealander (5.4%, a difference of 0.23%), Latvian (5.4%, a difference of 0.23%), and Arab (5.4%, a difference of 0.23%).
| Demographics | Rating | Rank | Disability Age 5 to 17 |
| Immigrants | Ethiopia | 95.5 /100 | #123 | Exceptional 5.4% |
| Crow | 95.0 /100 | #124 | Exceptional 5.4% |
| Immigrants | Chile | 95.0 /100 | #125 | Exceptional 5.4% |
| New Zealanders | 95.0 /100 | #126 | Exceptional 5.4% |
| Latvians | 95.0 /100 | #127 | Exceptional 5.4% |
| Immigrants | Venezuela | 94.5 /100 | #128 | Exceptional 5.4% |
| Romanians | 94.1 /100 | #129 | Exceptional 5.4% |
| Immigrants | Bulgaria | 94.0 /100 | #130 | Exceptional 5.4% |
| Arabs | 92.9 /100 | #131 | Exceptional 5.4% |
| Immigrants | Colombia | 92.9 /100 | #132 | Exceptional 5.4% |
| Venezuelans | 92.7 /100 | #133 | Exceptional 5.4% |
| Yuman | 92.3 /100 | #134 | Exceptional 5.4% |
| Immigrants | Belize | 91.7 /100 | #135 | Exceptional 5.4% |
| Immigrants | Denmark | 91.4 /100 | #136 | Exceptional 5.4% |
| Navajo | 90.9 /100 | #137 | Exceptional 5.4% |