Czech vs Alsatian Disability Age 5 to 17
COMPARE
Czech
Alsatian
Disability Age 5 to 17
Disability Age 5 to 17 Comparison
Czechs
Alsatians
5.8%
DISABILITY AGE 5 TO 17
7.4/ 100
METRIC RATING
217th/ 347
METRIC RANK
5.8%
DISABILITY AGE 5 TO 17
6.0/ 100
METRIC RATING
223rd/ 347
METRIC RANK
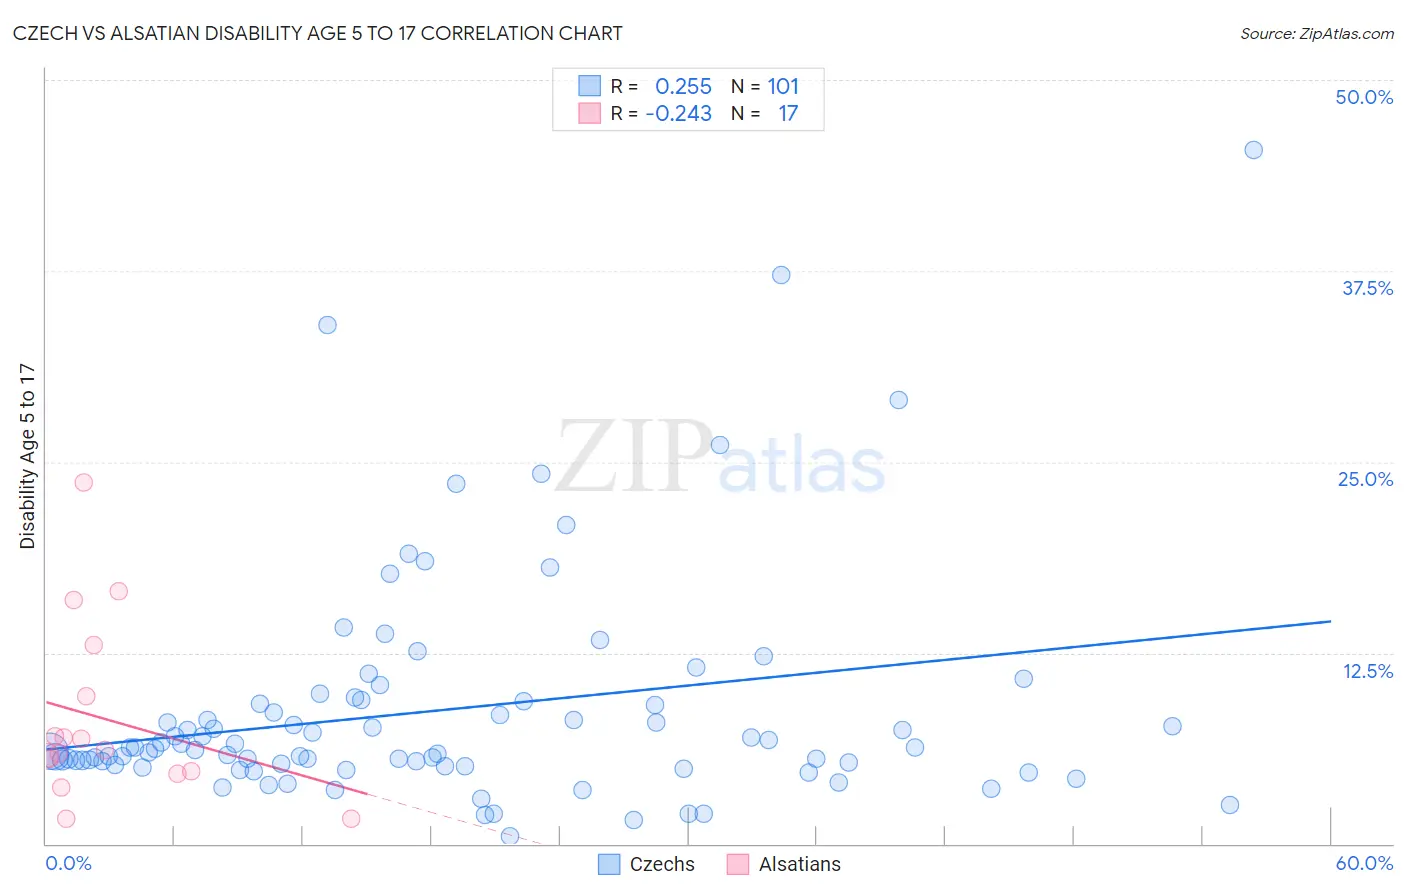
Czech vs Alsatian Disability Age 5 to 17 Correlation Chart
The statistical analysis conducted on geographies consisting of 477,643,997 people shows a weak positive correlation between the proportion of Czechs and percentage of population with a disability between the ages 5 and 17 in the United States with a correlation coefficient (R) of 0.255 and weighted average of 5.8%. Similarly, the statistical analysis conducted on geographies consisting of 82,434,825 people shows a weak negative correlation between the proportion of Alsatians and percentage of population with a disability between the ages 5 and 17 in the United States with a correlation coefficient (R) of -0.243 and weighted average of 5.8%, a difference of 0.26%.
Disability Age 5 to 17 Correlation Summary
| Measurement | Czech | Alsatian |
| Minimum | 0.52% | 1.6% |
| Maximum | 45.5% | 23.6% |
| Range | 44.9% | 22.0% |
| Mean | 8.8% | 8.2% |
| Median | 6.2% | 6.1% |
| Interquartile 25% (IQ1) | 5.1% | 4.7% |
| Interquartile 75% (IQ3) | 9.3% | 11.3% |
| Interquartile Range (IQR) | 4.1% | 6.6% |
| Standard Deviation (Sample) | 7.5% | 5.9% |
| Standard Deviation (Population) | 7.5% | 5.7% |
Demographics Similar to Czechs and Alsatians by Disability Age 5 to 17
In terms of disability age 5 to 17, the demographic groups most similar to Czechs are Nigerian (5.8%, a difference of 0.030%), Immigrants from Sierra Leone (5.8%, a difference of 0.050%), Sierra Leonean (5.8%, a difference of 0.060%), Belgian (5.8%, a difference of 0.080%), and Swedish (5.8%, a difference of 0.12%). Similarly, the demographic groups most similar to Alsatians are Mexican (5.8%, a difference of 0.060%), Guamanian/Chamorro (5.8%, a difference of 0.080%), British West Indian (5.8%, a difference of 0.12%), Lithuanian (5.8%, a difference of 0.15%), and Immigrants from Sudan (5.8%, a difference of 0.15%).
| Demographics | Rating | Rank | Disability Age 5 to 17 |
| Immigrants | Haiti | 9.5 /100 | #210 | Tragic 5.8% |
| Yugoslavians | 9.1 /100 | #211 | Tragic 5.8% |
| Immigrants | Panama | 8.7 /100 | #212 | Tragic 5.8% |
| Immigrants | Cameroon | 8.3 /100 | #213 | Tragic 5.8% |
| Immigrants | Morocco | 8.3 /100 | #214 | Tragic 5.8% |
| Swedes | 8.1 /100 | #215 | Tragic 5.8% |
| Nigerians | 7.5 /100 | #216 | Tragic 5.8% |
| Czechs | 7.4 /100 | #217 | Tragic 5.8% |
| Immigrants | Sierra Leone | 7.1 /100 | #218 | Tragic 5.8% |
| Sierra Leoneans | 7.0 /100 | #219 | Tragic 5.8% |
| Belgians | 6.9 /100 | #220 | Tragic 5.8% |
| Lithuanians | 6.7 /100 | #221 | Tragic 5.8% |
| Immigrants | Sudan | 6.7 /100 | #222 | Tragic 5.8% |
| Alsatians | 6.0 /100 | #223 | Tragic 5.8% |
| Mexicans | 5.7 /100 | #224 | Tragic 5.8% |
| Guamanians/Chamorros | 5.6 /100 | #225 | Tragic 5.8% |
| British West Indians | 5.4 /100 | #226 | Tragic 5.8% |
| Swiss | 5.1 /100 | #227 | Tragic 5.8% |
| Haitians | 4.8 /100 | #228 | Tragic 5.8% |
| Bangladeshis | 4.8 /100 | #229 | Tragic 5.8% |
| Ghanaians | 4.7 /100 | #230 | Tragic 5.8% |