Inupiat vs Alsatian Disability Age 5 to 17
COMPARE
Inupiat
Alsatian
Disability Age 5 to 17
Disability Age 5 to 17 Comparison
Inupiat
Alsatians
5.7%
DISABILITY AGE 5 TO 17
23.3/ 100
METRIC RATING
196th/ 347
METRIC RANK
5.8%
DISABILITY AGE 5 TO 17
6.0/ 100
METRIC RATING
223rd/ 347
METRIC RANK
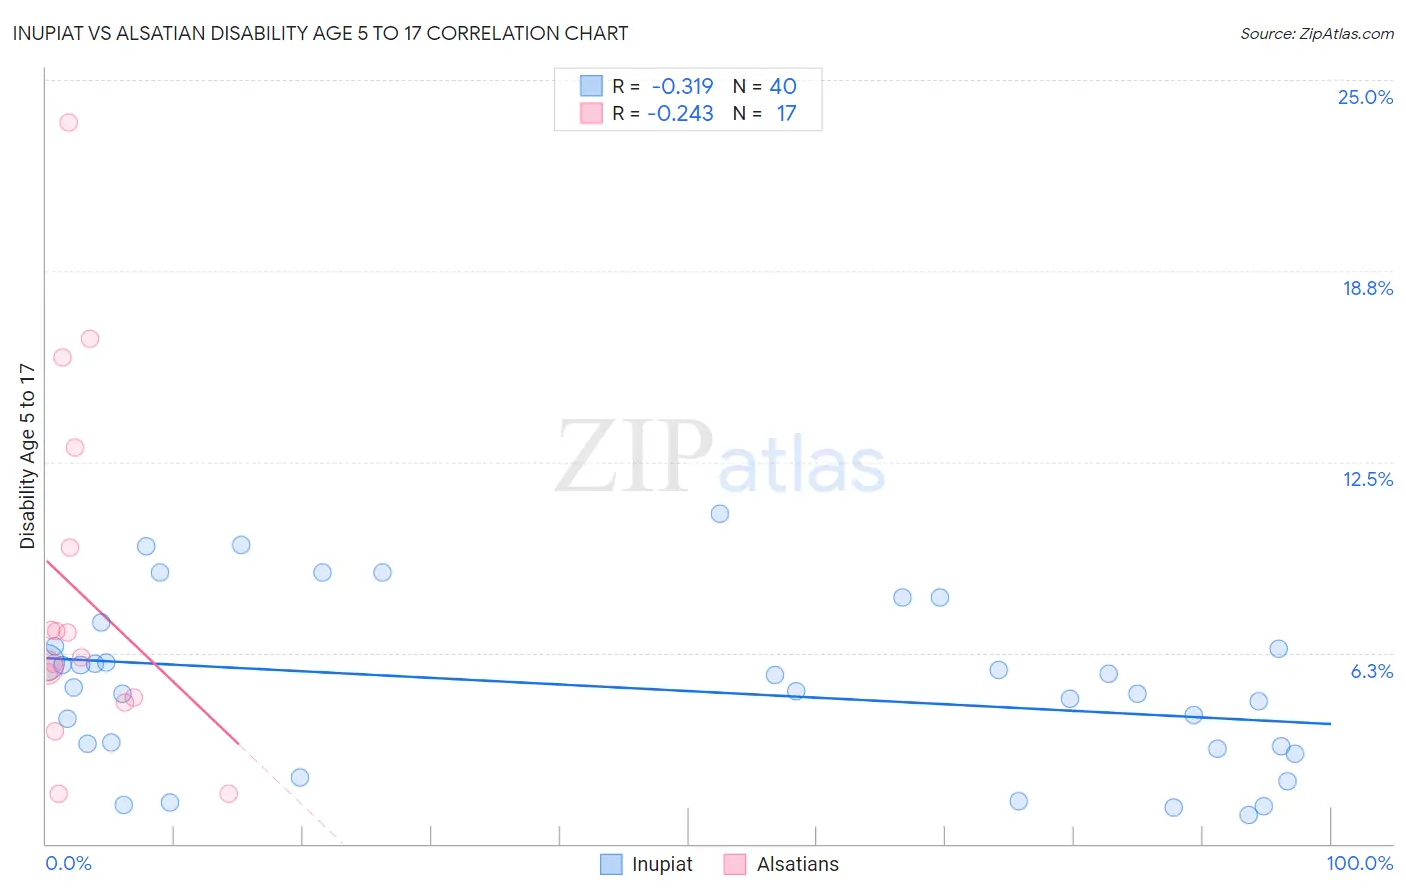
Inupiat vs Alsatian Disability Age 5 to 17 Correlation Chart
The statistical analysis conducted on geographies consisting of 96,104,809 people shows a mild negative correlation between the proportion of Inupiat and percentage of population with a disability between the ages 5 and 17 in the United States with a correlation coefficient (R) of -0.319 and weighted average of 5.7%. Similarly, the statistical analysis conducted on geographies consisting of 82,434,825 people shows a weak negative correlation between the proportion of Alsatians and percentage of population with a disability between the ages 5 and 17 in the United States with a correlation coefficient (R) of -0.243 and weighted average of 5.8%, a difference of 1.9%.
Disability Age 5 to 17 Correlation Summary
| Measurement | Inupiat | Alsatian |
| Minimum | 0.93% | 1.6% |
| Maximum | 10.8% | 23.6% |
| Range | 9.9% | 22.0% |
| Mean | 5.1% | 8.2% |
| Median | 5.1% | 6.1% |
| Interquartile 25% (IQ1) | 3.2% | 4.7% |
| Interquartile 75% (IQ3) | 6.4% | 11.3% |
| Interquartile Range (IQR) | 3.3% | 6.6% |
| Standard Deviation (Sample) | 2.7% | 5.9% |
| Standard Deviation (Population) | 2.6% | 5.7% |
Similar Demographics by Disability Age 5 to 17
Demographics Similar to Inupiat by Disability Age 5 to 17
In terms of disability age 5 to 17, the demographic groups most similar to Inupiat are Immigrants from Nigeria (5.7%, a difference of 0.010%), Immigrants from North America (5.7%, a difference of 0.010%), Croatian (5.7%, a difference of 0.020%), Norwegian (5.7%, a difference of 0.17%), and Immigrants from Canada (5.7%, a difference of 0.18%).
| Demographics | Rating | Rank | Disability Age 5 to 17 |
| Pueblo | 27.5 /100 | #189 | Fair 5.7% |
| Immigrants | Eastern Africa | 27.3 /100 | #190 | Fair 5.7% |
| Danes | 26.5 /100 | #191 | Fair 5.7% |
| Immigrants | Bosnia and Herzegovina | 26.3 /100 | #192 | Fair 5.7% |
| Immigrants | Canada | 26.1 /100 | #193 | Fair 5.7% |
| Croatians | 23.6 /100 | #194 | Fair 5.7% |
| Immigrants | Nigeria | 23.4 /100 | #195 | Fair 5.7% |
| Inupiat | 23.3 /100 | #196 | Fair 5.7% |
| Immigrants | North America | 23.1 /100 | #197 | Fair 5.7% |
| Norwegians | 20.9 /100 | #198 | Fair 5.7% |
| Northern Europeans | 15.2 /100 | #199 | Poor 5.7% |
| Icelanders | 14.6 /100 | #200 | Poor 5.7% |
| Basques | 13.7 /100 | #201 | Poor 5.7% |
| Austrians | 13.2 /100 | #202 | Poor 5.7% |
| Spanish American Indians | 12.8 /100 | #203 | Poor 5.7% |
Demographics Similar to Alsatians by Disability Age 5 to 17
In terms of disability age 5 to 17, the demographic groups most similar to Alsatians are Mexican (5.8%, a difference of 0.060%), Guamanian/Chamorro (5.8%, a difference of 0.080%), British West Indian (5.8%, a difference of 0.12%), Lithuanian (5.8%, a difference of 0.15%), and Immigrants from Sudan (5.8%, a difference of 0.15%).
| Demographics | Rating | Rank | Disability Age 5 to 17 |
| Nigerians | 7.5 /100 | #216 | Tragic 5.8% |
| Czechs | 7.4 /100 | #217 | Tragic 5.8% |
| Immigrants | Sierra Leone | 7.1 /100 | #218 | Tragic 5.8% |
| Sierra Leoneans | 7.0 /100 | #219 | Tragic 5.8% |
| Belgians | 6.9 /100 | #220 | Tragic 5.8% |
| Lithuanians | 6.7 /100 | #221 | Tragic 5.8% |
| Immigrants | Sudan | 6.7 /100 | #222 | Tragic 5.8% |
| Alsatians | 6.0 /100 | #223 | Tragic 5.8% |
| Mexicans | 5.7 /100 | #224 | Tragic 5.8% |
| Guamanians/Chamorros | 5.6 /100 | #225 | Tragic 5.8% |
| British West Indians | 5.4 /100 | #226 | Tragic 5.8% |
| Swiss | 5.1 /100 | #227 | Tragic 5.8% |
| Haitians | 4.8 /100 | #228 | Tragic 5.8% |
| Bangladeshis | 4.8 /100 | #229 | Tragic 5.8% |
| Ghanaians | 4.7 /100 | #230 | Tragic 5.8% |