Welsh vs Alsatian Disability Age 5 to 17
COMPARE
Welsh
Alsatian
Disability Age 5 to 17
Disability Age 5 to 17 Comparison
Welsh
Alsatians
6.3%
DISABILITY AGE 5 TO 17
0.0/ 100
METRIC RATING
299th/ 347
METRIC RANK
5.8%
DISABILITY AGE 5 TO 17
6.0/ 100
METRIC RATING
223rd/ 347
METRIC RANK
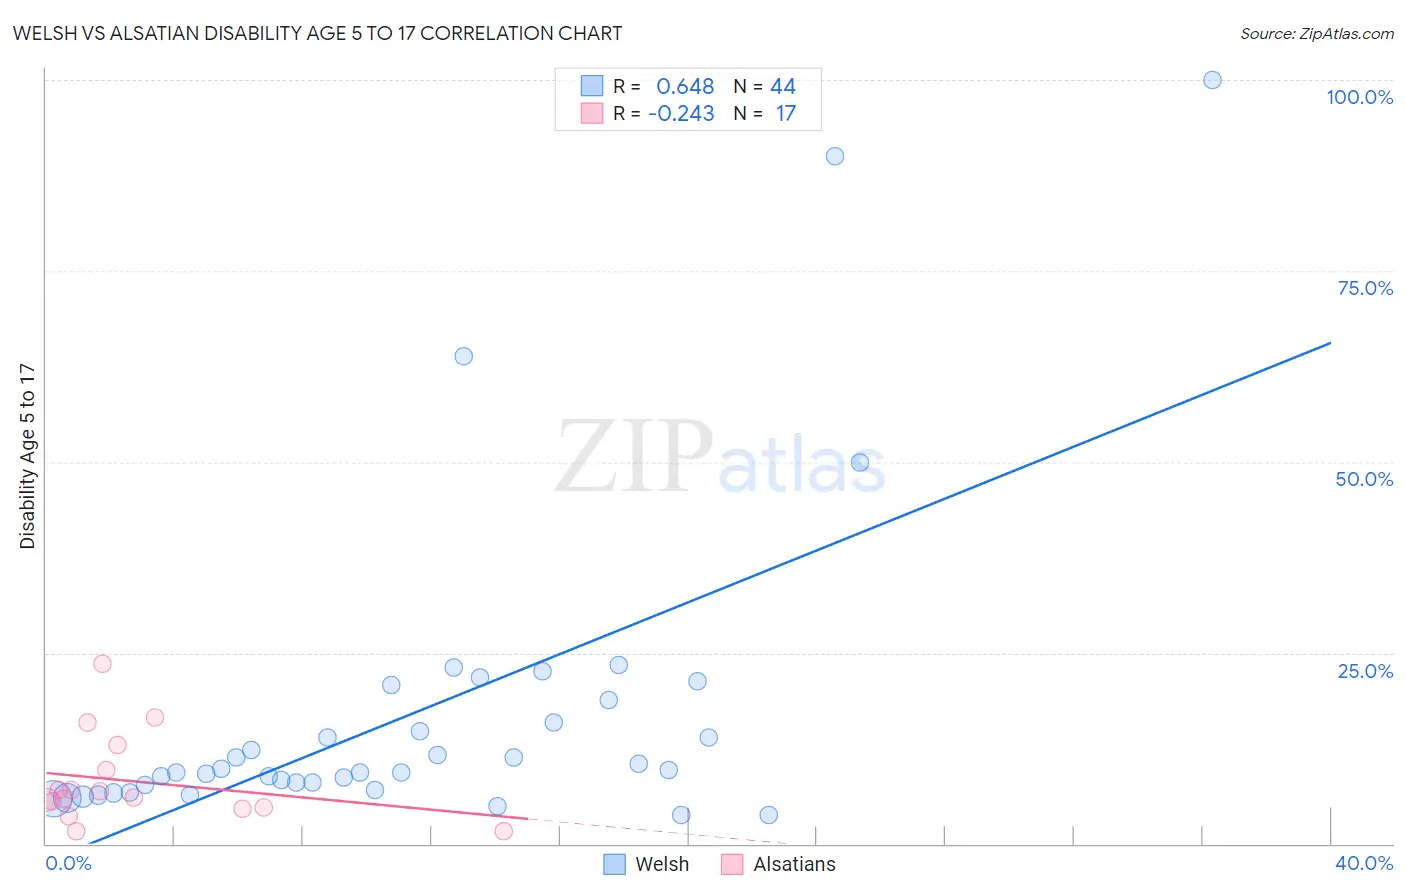
Welsh vs Alsatian Disability Age 5 to 17 Correlation Chart
The statistical analysis conducted on geographies consisting of 518,817,158 people shows a significant positive correlation between the proportion of Welsh and percentage of population with a disability between the ages 5 and 17 in the United States with a correlation coefficient (R) of 0.648 and weighted average of 6.3%. Similarly, the statistical analysis conducted on geographies consisting of 82,434,825 people shows a weak negative correlation between the proportion of Alsatians and percentage of population with a disability between the ages 5 and 17 in the United States with a correlation coefficient (R) of -0.243 and weighted average of 5.8%, a difference of 8.0%.
Disability Age 5 to 17 Correlation Summary
| Measurement | Welsh | Alsatian |
| Minimum | 3.7% | 1.6% |
| Maximum | 100.0% | 23.6% |
| Range | 96.3% | 22.0% |
| Mean | 17.0% | 8.2% |
| Median | 9.5% | 6.1% |
| Interquartile 25% (IQ1) | 7.4% | 4.7% |
| Interquartile 75% (IQ3) | 17.4% | 11.3% |
| Interquartile Range (IQR) | 9.9% | 6.6% |
| Standard Deviation (Sample) | 20.5% | 5.9% |
| Standard Deviation (Population) | 20.3% | 5.7% |
Similar Demographics by Disability Age 5 to 17
Demographics Similar to Welsh by Disability Age 5 to 17
In terms of disability age 5 to 17, the demographic groups most similar to Welsh are Carpatho Rusyn (6.3%, a difference of 0.12%), U.S. Virgin Islander (6.3%, a difference of 0.14%), Lumbee (6.2%, a difference of 0.15%), Immigrants from Bahamas (6.2%, a difference of 0.22%), and Spanish American (6.2%, a difference of 0.35%).
| Demographics | Rating | Rank | Disability Age 5 to 17 |
| Immigrants | Senegal | 0.0 /100 | #292 | Tragic 6.2% |
| Central American Indians | 0.0 /100 | #293 | Tragic 6.2% |
| Irish | 0.0 /100 | #294 | Tragic 6.2% |
| Cree | 0.0 /100 | #295 | Tragic 6.2% |
| Spanish Americans | 0.0 /100 | #296 | Tragic 6.2% |
| Immigrants | Bahamas | 0.0 /100 | #297 | Tragic 6.2% |
| Lumbee | 0.0 /100 | #298 | Tragic 6.2% |
| Welsh | 0.0 /100 | #299 | Tragic 6.3% |
| Carpatho Rusyns | 0.0 /100 | #300 | Tragic 6.3% |
| U.S. Virgin Islanders | 0.0 /100 | #301 | Tragic 6.3% |
| Celtics | 0.0 /100 | #302 | Tragic 6.3% |
| Yakama | 0.0 /100 | #303 | Tragic 6.3% |
| Senegalese | 0.0 /100 | #304 | Tragic 6.3% |
| Natives/Alaskans | 0.0 /100 | #305 | Tragic 6.3% |
| Immigrants | Nonimmigrants | 0.0 /100 | #306 | Tragic 6.3% |
Demographics Similar to Alsatians by Disability Age 5 to 17
In terms of disability age 5 to 17, the demographic groups most similar to Alsatians are Mexican (5.8%, a difference of 0.060%), Guamanian/Chamorro (5.8%, a difference of 0.080%), British West Indian (5.8%, a difference of 0.12%), Lithuanian (5.8%, a difference of 0.15%), and Immigrants from Sudan (5.8%, a difference of 0.15%).
| Demographics | Rating | Rank | Disability Age 5 to 17 |
| Nigerians | 7.5 /100 | #216 | Tragic 5.8% |
| Czechs | 7.4 /100 | #217 | Tragic 5.8% |
| Immigrants | Sierra Leone | 7.1 /100 | #218 | Tragic 5.8% |
| Sierra Leoneans | 7.0 /100 | #219 | Tragic 5.8% |
| Belgians | 6.9 /100 | #220 | Tragic 5.8% |
| Lithuanians | 6.7 /100 | #221 | Tragic 5.8% |
| Immigrants | Sudan | 6.7 /100 | #222 | Tragic 5.8% |
| Alsatians | 6.0 /100 | #223 | Tragic 5.8% |
| Mexicans | 5.7 /100 | #224 | Tragic 5.8% |
| Guamanians/Chamorros | 5.6 /100 | #225 | Tragic 5.8% |
| British West Indians | 5.4 /100 | #226 | Tragic 5.8% |
| Swiss | 5.1 /100 | #227 | Tragic 5.8% |
| Haitians | 4.8 /100 | #228 | Tragic 5.8% |
| Bangladeshis | 4.8 /100 | #229 | Tragic 5.8% |
| Ghanaians | 4.7 /100 | #230 | Tragic 5.8% |