Japanese vs Alsatian Disability Age 5 to 17
COMPARE
Japanese
Alsatian
Disability Age 5 to 17
Disability Age 5 to 17 Comparison
Japanese
Alsatians
6.1%
DISABILITY AGE 5 TO 17
0.1/ 100
METRIC RATING
276th/ 347
METRIC RANK
5.8%
DISABILITY AGE 5 TO 17
6.0/ 100
METRIC RATING
223rd/ 347
METRIC RANK
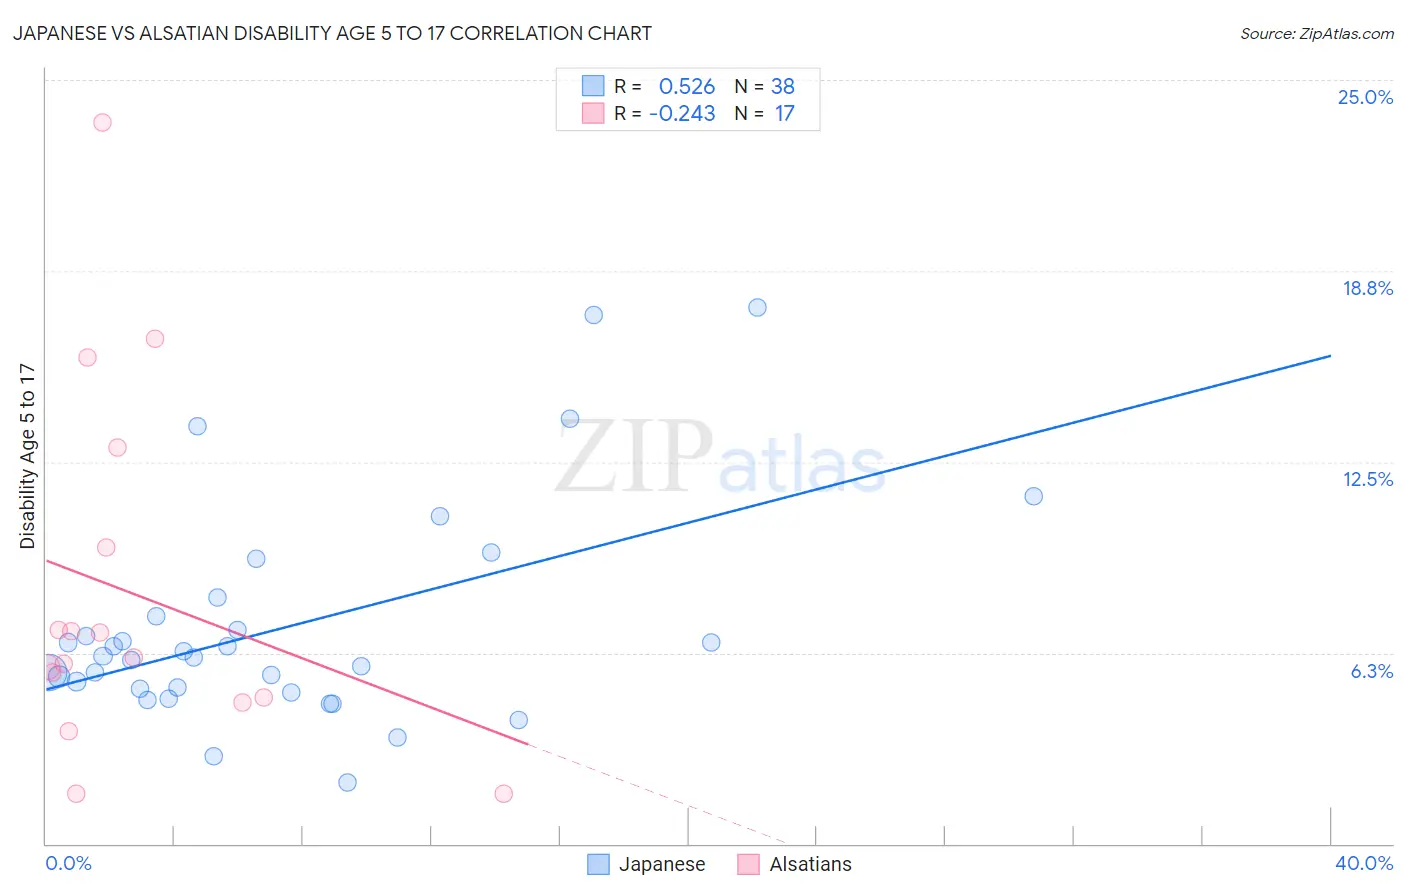
Japanese vs Alsatian Disability Age 5 to 17 Correlation Chart
The statistical analysis conducted on geographies consisting of 248,392,506 people shows a substantial positive correlation between the proportion of Japanese and percentage of population with a disability between the ages 5 and 17 in the United States with a correlation coefficient (R) of 0.526 and weighted average of 6.1%. Similarly, the statistical analysis conducted on geographies consisting of 82,434,825 people shows a weak negative correlation between the proportion of Alsatians and percentage of population with a disability between the ages 5 and 17 in the United States with a correlation coefficient (R) of -0.243 and weighted average of 5.8%, a difference of 4.5%.
Disability Age 5 to 17 Correlation Summary
| Measurement | Japanese | Alsatian |
| Minimum | 2.0% | 1.6% |
| Maximum | 17.6% | 23.6% |
| Range | 15.6% | 22.0% |
| Mean | 7.1% | 8.2% |
| Median | 6.1% | 6.1% |
| Interquartile 25% (IQ1) | 5.1% | 4.7% |
| Interquartile 75% (IQ3) | 7.5% | 11.3% |
| Interquartile Range (IQR) | 2.4% | 6.6% |
| Standard Deviation (Sample) | 3.6% | 5.9% |
| Standard Deviation (Population) | 3.5% | 5.7% |
Similar Demographics by Disability Age 5 to 17
Demographics Similar to Japanese by Disability Age 5 to 17
In terms of disability age 5 to 17, the demographic groups most similar to Japanese are Dutch (6.0%, a difference of 0.11%), Cheyenne (6.0%, a difference of 0.21%), Alaska Native (6.0%, a difference of 0.33%), Finnish (6.0%, a difference of 0.38%), and Immigrants from Zaire (6.0%, a difference of 0.40%).
| Demographics | Rating | Rank | Disability Age 5 to 17 |
| Liberians | 0.4 /100 | #269 | Tragic 6.0% |
| Immigrants | Somalia | 0.4 /100 | #270 | Tragic 6.0% |
| Immigrants | Zaire | 0.2 /100 | #271 | Tragic 6.0% |
| Finns | 0.2 /100 | #272 | Tragic 6.0% |
| Alaska Natives | 0.2 /100 | #273 | Tragic 6.0% |
| Cheyenne | 0.2 /100 | #274 | Tragic 6.0% |
| Dutch | 0.2 /100 | #275 | Tragic 6.0% |
| Japanese | 0.1 /100 | #276 | Tragic 6.1% |
| Puget Sound Salish | 0.1 /100 | #277 | Tragic 6.1% |
| Immigrants | Liberia | 0.1 /100 | #278 | Tragic 6.1% |
| Immigrants | Jamaica | 0.1 /100 | #279 | Tragic 6.1% |
| Portuguese | 0.1 /100 | #280 | Tragic 6.1% |
| Scottish | 0.0 /100 | #281 | Tragic 6.1% |
| Germans | 0.0 /100 | #282 | Tragic 6.1% |
| Ugandans | 0.0 /100 | #283 | Tragic 6.2% |
Demographics Similar to Alsatians by Disability Age 5 to 17
In terms of disability age 5 to 17, the demographic groups most similar to Alsatians are Mexican (5.8%, a difference of 0.060%), Guamanian/Chamorro (5.8%, a difference of 0.080%), British West Indian (5.8%, a difference of 0.12%), Lithuanian (5.8%, a difference of 0.15%), and Immigrants from Sudan (5.8%, a difference of 0.15%).
| Demographics | Rating | Rank | Disability Age 5 to 17 |
| Nigerians | 7.5 /100 | #216 | Tragic 5.8% |
| Czechs | 7.4 /100 | #217 | Tragic 5.8% |
| Immigrants | Sierra Leone | 7.1 /100 | #218 | Tragic 5.8% |
| Sierra Leoneans | 7.0 /100 | #219 | Tragic 5.8% |
| Belgians | 6.9 /100 | #220 | Tragic 5.8% |
| Lithuanians | 6.7 /100 | #221 | Tragic 5.8% |
| Immigrants | Sudan | 6.7 /100 | #222 | Tragic 5.8% |
| Alsatians | 6.0 /100 | #223 | Tragic 5.8% |
| Mexicans | 5.7 /100 | #224 | Tragic 5.8% |
| Guamanians/Chamorros | 5.6 /100 | #225 | Tragic 5.8% |
| British West Indians | 5.4 /100 | #226 | Tragic 5.8% |
| Swiss | 5.1 /100 | #227 | Tragic 5.8% |
| Haitians | 4.8 /100 | #228 | Tragic 5.8% |
| Bangladeshis | 4.8 /100 | #229 | Tragic 5.8% |
| Ghanaians | 4.7 /100 | #230 | Tragic 5.8% |