Alsatian vs Alaskan Athabascan Disability Age 5 to 17
COMPARE
Alsatian
Alaskan Athabascan
Disability Age 5 to 17
Disability Age 5 to 17 Comparison
Alsatians
Alaskan Athabascans
5.8%
DISABILITY AGE 5 TO 17
6.0/ 100
METRIC RATING
223rd/ 347
METRIC RANK
6.3%
DISABILITY AGE 5 TO 17
0.0/ 100
METRIC RATING
310th/ 347
METRIC RANK
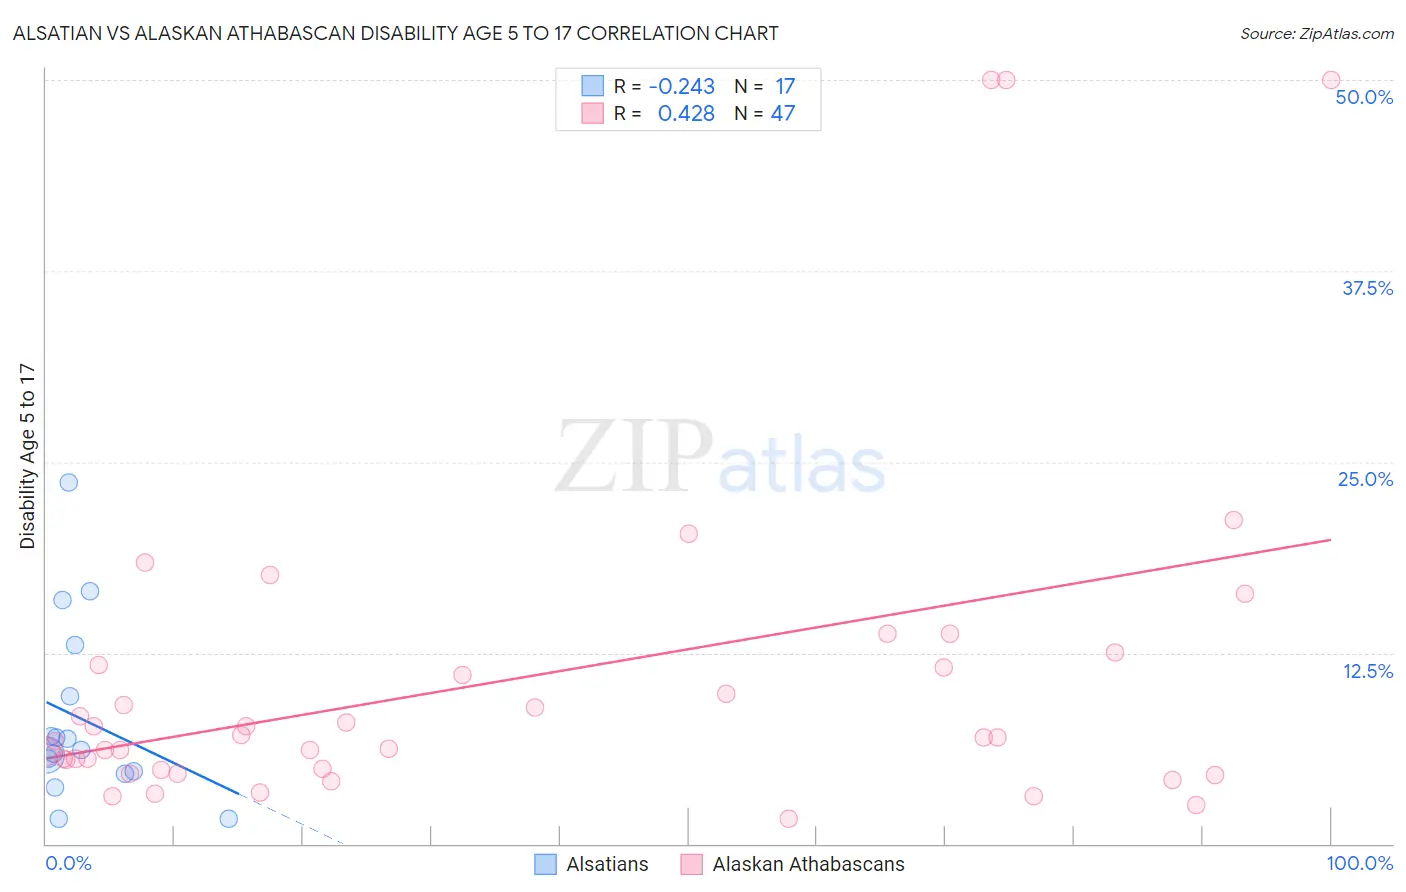
Alsatian vs Alaskan Athabascan Disability Age 5 to 17 Correlation Chart
The statistical analysis conducted on geographies consisting of 82,434,825 people shows a weak negative correlation between the proportion of Alsatians and percentage of population with a disability between the ages 5 and 17 in the United States with a correlation coefficient (R) of -0.243 and weighted average of 5.8%. Similarly, the statistical analysis conducted on geographies consisting of 45,771,406 people shows a moderate positive correlation between the proportion of Alaskan Athabascans and percentage of population with a disability between the ages 5 and 17 in the United States with a correlation coefficient (R) of 0.428 and weighted average of 6.3%, a difference of 9.6%.
Disability Age 5 to 17 Correlation Summary
| Measurement | Alsatian | Alaskan Athabascan |
| Minimum | 1.6% | 1.7% |
| Maximum | 23.6% | 50.0% |
| Range | 22.0% | 48.3% |
| Mean | 8.2% | 10.8% |
| Median | 6.1% | 7.0% |
| Interquartile 25% (IQ1) | 4.7% | 4.8% |
| Interquartile 75% (IQ3) | 11.3% | 11.7% |
| Interquartile Range (IQR) | 6.6% | 6.9% |
| Standard Deviation (Sample) | 5.9% | 11.4% |
| Standard Deviation (Population) | 5.7% | 11.2% |
Similar Demographics by Disability Age 5 to 17
Demographics Similar to Alsatians by Disability Age 5 to 17
In terms of disability age 5 to 17, the demographic groups most similar to Alsatians are Mexican (5.8%, a difference of 0.060%), Guamanian/Chamorro (5.8%, a difference of 0.080%), British West Indian (5.8%, a difference of 0.12%), Lithuanian (5.8%, a difference of 0.15%), and Immigrants from Sudan (5.8%, a difference of 0.15%).
| Demographics | Rating | Rank | Disability Age 5 to 17 |
| Nigerians | 7.5 /100 | #216 | Tragic 5.8% |
| Czechs | 7.4 /100 | #217 | Tragic 5.8% |
| Immigrants | Sierra Leone | 7.1 /100 | #218 | Tragic 5.8% |
| Sierra Leoneans | 7.0 /100 | #219 | Tragic 5.8% |
| Belgians | 6.9 /100 | #220 | Tragic 5.8% |
| Lithuanians | 6.7 /100 | #221 | Tragic 5.8% |
| Immigrants | Sudan | 6.7 /100 | #222 | Tragic 5.8% |
| Alsatians | 6.0 /100 | #223 | Tragic 5.8% |
| Mexicans | 5.7 /100 | #224 | Tragic 5.8% |
| Guamanians/Chamorros | 5.6 /100 | #225 | Tragic 5.8% |
| British West Indians | 5.4 /100 | #226 | Tragic 5.8% |
| Swiss | 5.1 /100 | #227 | Tragic 5.8% |
| Haitians | 4.8 /100 | #228 | Tragic 5.8% |
| Bangladeshis | 4.8 /100 | #229 | Tragic 5.8% |
| Ghanaians | 4.7 /100 | #230 | Tragic 5.8% |
Demographics Similar to Alaskan Athabascans by Disability Age 5 to 17
In terms of disability age 5 to 17, the demographic groups most similar to Alaskan Athabascans are Immigrants from Dominica (6.3%, a difference of 0.040%), Hmong (6.3%, a difference of 0.13%), Scotch-Irish (6.3%, a difference of 0.16%), Bermudan (6.4%, a difference of 0.16%), and Bahamian (6.3%, a difference of 0.39%).
| Demographics | Rating | Rank | Disability Age 5 to 17 |
| Yakama | 0.0 /100 | #303 | Tragic 6.3% |
| Senegalese | 0.0 /100 | #304 | Tragic 6.3% |
| Natives/Alaskans | 0.0 /100 | #305 | Tragic 6.3% |
| Immigrants | Nonimmigrants | 0.0 /100 | #306 | Tragic 6.3% |
| Bahamians | 0.0 /100 | #307 | Tragic 6.3% |
| Scotch-Irish | 0.0 /100 | #308 | Tragic 6.3% |
| Hmong | 0.0 /100 | #309 | Tragic 6.3% |
| Alaskan Athabascans | 0.0 /100 | #310 | Tragic 6.3% |
| Immigrants | Dominica | 0.0 /100 | #311 | Tragic 6.3% |
| Bermudans | 0.0 /100 | #312 | Tragic 6.4% |
| Apache | 0.0 /100 | #313 | Tragic 6.4% |
| French | 0.0 /100 | #314 | Tragic 6.4% |
| Immigrants | Portugal | 0.0 /100 | #315 | Tragic 6.4% |
| Immigrants | Dominican Republic | 0.0 /100 | #316 | Tragic 6.4% |
| Kiowa | 0.0 /100 | #317 | Tragic 6.4% |