Creek vs Alaskan Athabascan Disability Age 5 to 17
COMPARE
Creek
Alaskan Athabascan
Disability Age 5 to 17
Disability Age 5 to 17 Comparison
Creek
Alaskan Athabascans
6.9%
DISABILITY AGE 5 TO 17
0.0/ 100
METRIC RATING
337th/ 347
METRIC RANK
6.3%
DISABILITY AGE 5 TO 17
0.0/ 100
METRIC RATING
310th/ 347
METRIC RANK
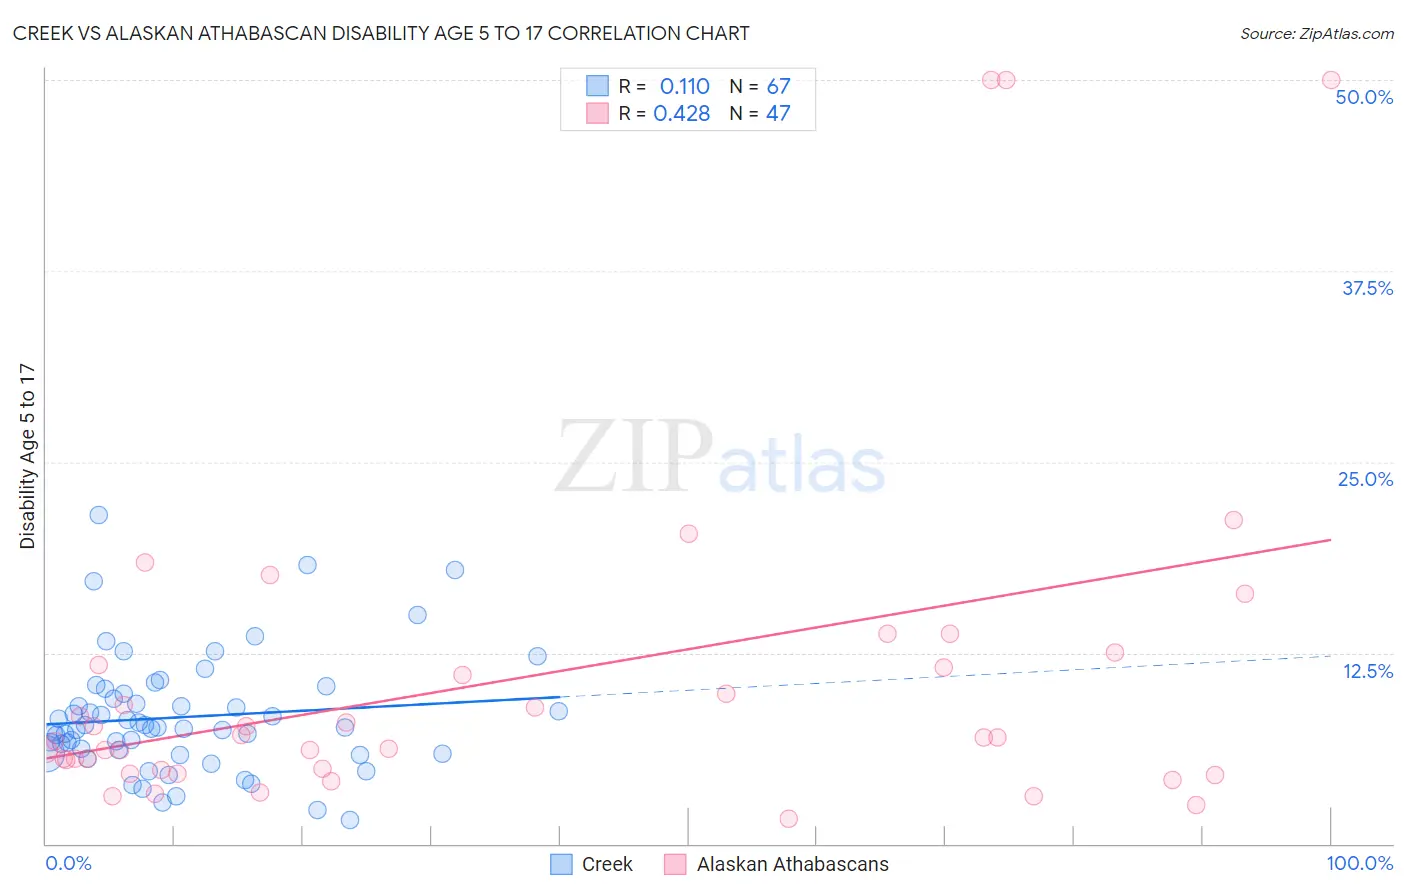
Creek vs Alaskan Athabascan Disability Age 5 to 17 Correlation Chart
The statistical analysis conducted on geographies consisting of 177,779,638 people shows a poor positive correlation between the proportion of Creek and percentage of population with a disability between the ages 5 and 17 in the United States with a correlation coefficient (R) of 0.110 and weighted average of 6.9%. Similarly, the statistical analysis conducted on geographies consisting of 45,771,406 people shows a moderate positive correlation between the proportion of Alaskan Athabascans and percentage of population with a disability between the ages 5 and 17 in the United States with a correlation coefficient (R) of 0.428 and weighted average of 6.3%, a difference of 8.3%.
Disability Age 5 to 17 Correlation Summary
| Measurement | Creek | Alaskan Athabascan |
| Minimum | 1.5% | 1.7% |
| Maximum | 21.5% | 50.0% |
| Range | 20.0% | 48.3% |
| Mean | 8.3% | 10.8% |
| Median | 7.6% | 7.0% |
| Interquartile 25% (IQ1) | 5.9% | 4.8% |
| Interquartile 75% (IQ3) | 9.8% | 11.7% |
| Interquartile Range (IQR) | 4.0% | 6.9% |
| Standard Deviation (Sample) | 3.8% | 11.4% |
| Standard Deviation (Population) | 3.8% | 11.2% |
Similar Demographics by Disability Age 5 to 17
Demographics Similar to Creek by Disability Age 5 to 17
In terms of disability age 5 to 17, the demographic groups most similar to Creek are Iroquois (6.9%, a difference of 0.24%), Chickasaw (6.8%, a difference of 0.43%), Choctaw (6.9%, a difference of 0.57%), Cherokee (6.9%, a difference of 0.83%), and Ottawa (6.8%, a difference of 0.93%).
| Demographics | Rating | Rank | Disability Age 5 to 17 |
| Dutch West Indians | 0.0 /100 | #330 | Tragic 6.7% |
| French Canadians | 0.0 /100 | #331 | Tragic 6.7% |
| Immigrants | Azores | 0.0 /100 | #332 | Tragic 6.7% |
| Blacks/African Americans | 0.0 /100 | #333 | Tragic 6.8% |
| Seminole | 0.0 /100 | #334 | Tragic 6.8% |
| Ottawa | 0.0 /100 | #335 | Tragic 6.8% |
| Chickasaw | 0.0 /100 | #336 | Tragic 6.8% |
| Creek | 0.0 /100 | #337 | Tragic 6.9% |
| Iroquois | 0.0 /100 | #338 | Tragic 6.9% |
| Choctaw | 0.0 /100 | #339 | Tragic 6.9% |
| Cherokee | 0.0 /100 | #340 | Tragic 6.9% |
| Cape Verdeans | 0.0 /100 | #341 | Tragic 7.0% |
| Chippewa | 0.0 /100 | #342 | Tragic 7.1% |
| Immigrants | Cabo Verde | 0.0 /100 | #343 | Tragic 7.1% |
| Cajuns | 0.0 /100 | #344 | Tragic 7.2% |
Demographics Similar to Alaskan Athabascans by Disability Age 5 to 17
In terms of disability age 5 to 17, the demographic groups most similar to Alaskan Athabascans are Immigrants from Dominica (6.3%, a difference of 0.040%), Hmong (6.3%, a difference of 0.13%), Scotch-Irish (6.3%, a difference of 0.16%), Bermudan (6.4%, a difference of 0.16%), and Bahamian (6.3%, a difference of 0.39%).
| Demographics | Rating | Rank | Disability Age 5 to 17 |
| Yakama | 0.0 /100 | #303 | Tragic 6.3% |
| Senegalese | 0.0 /100 | #304 | Tragic 6.3% |
| Natives/Alaskans | 0.0 /100 | #305 | Tragic 6.3% |
| Immigrants | Nonimmigrants | 0.0 /100 | #306 | Tragic 6.3% |
| Bahamians | 0.0 /100 | #307 | Tragic 6.3% |
| Scotch-Irish | 0.0 /100 | #308 | Tragic 6.3% |
| Hmong | 0.0 /100 | #309 | Tragic 6.3% |
| Alaskan Athabascans | 0.0 /100 | #310 | Tragic 6.3% |
| Immigrants | Dominica | 0.0 /100 | #311 | Tragic 6.3% |
| Bermudans | 0.0 /100 | #312 | Tragic 6.4% |
| Apache | 0.0 /100 | #313 | Tragic 6.4% |
| French | 0.0 /100 | #314 | Tragic 6.4% |
| Immigrants | Portugal | 0.0 /100 | #315 | Tragic 6.4% |
| Immigrants | Dominican Republic | 0.0 /100 | #316 | Tragic 6.4% |
| Kiowa | 0.0 /100 | #317 | Tragic 6.4% |