Ghanaian vs Immigrants from Micronesia 7th Grade
COMPARE
Ghanaian
Immigrants from Micronesia
7th Grade
7th Grade Comparison
Ghanaians
Immigrants from Micronesia
95.3%
7TH GRADE
0.7/ 100
METRIC RATING
258th/ 347
METRIC RANK
95.9%
7TH GRADE
32.6/ 100
METRIC RATING
190th/ 347
METRIC RANK
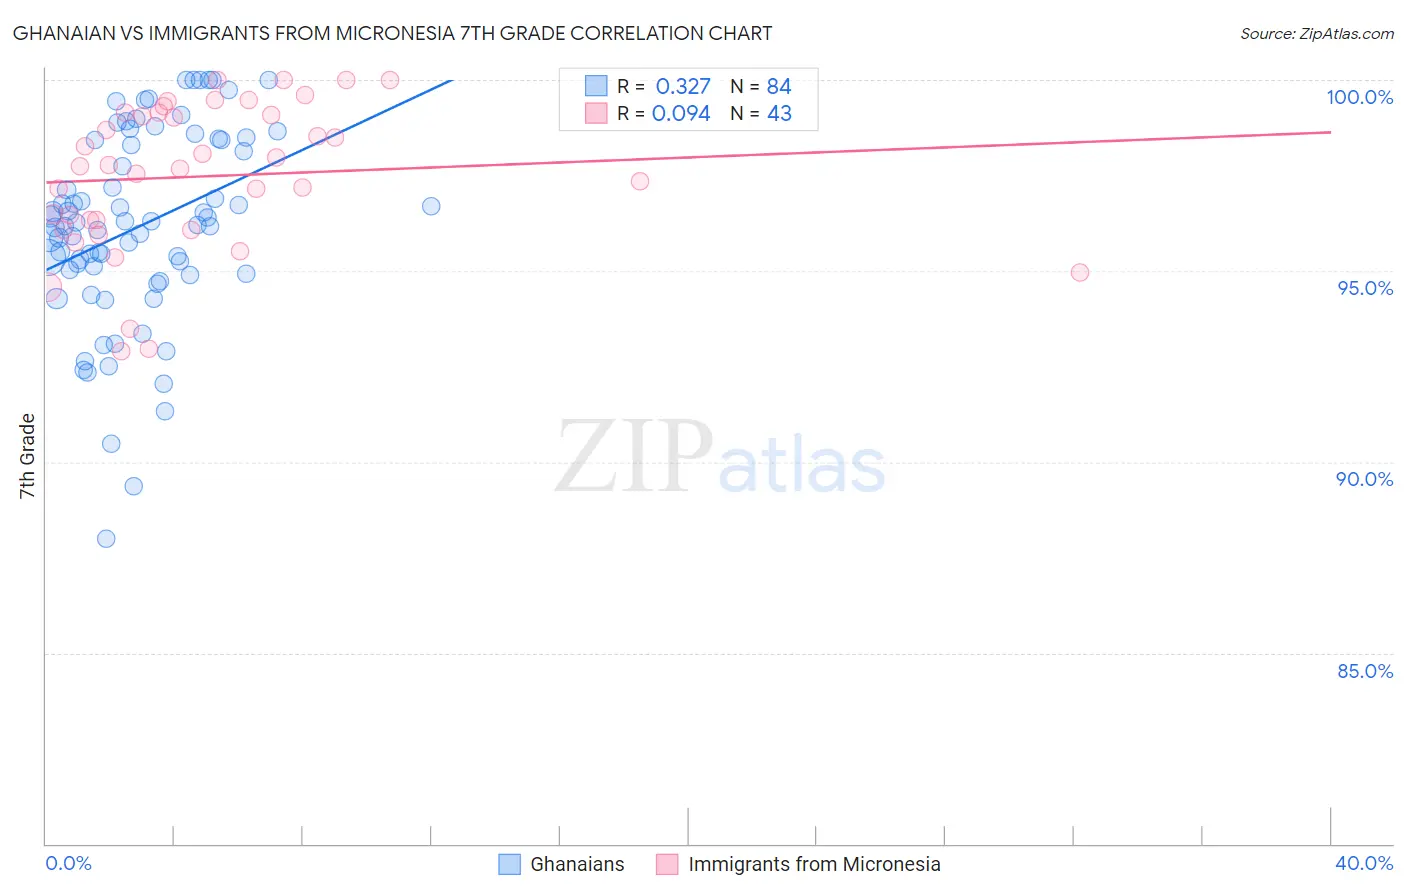
Ghanaian vs Immigrants from Micronesia 7th Grade Correlation Chart
The statistical analysis conducted on geographies consisting of 190,712,873 people shows a mild positive correlation between the proportion of Ghanaians and percentage of population with at least 7th grade education in the United States with a correlation coefficient (R) of 0.327 and weighted average of 95.3%. Similarly, the statistical analysis conducted on geographies consisting of 61,604,657 people shows a slight positive correlation between the proportion of Immigrants from Micronesia and percentage of population with at least 7th grade education in the United States with a correlation coefficient (R) of 0.094 and weighted average of 95.9%, a difference of 0.65%.
7th Grade Correlation Summary
| Measurement | Ghanaian | Immigrants from Micronesia |
| Minimum | 88.0% | 92.9% |
| Maximum | 100.0% | 100.0% |
| Range | 12.0% | 7.1% |
| Mean | 96.2% | 97.5% |
| Median | 96.2% | 97.7% |
| Interquartile 25% (IQ1) | 95.0% | 96.1% |
| Interquartile 75% (IQ3) | 98.4% | 99.1% |
| Interquartile Range (IQR) | 3.4% | 3.1% |
| Standard Deviation (Sample) | 2.5% | 1.9% |
| Standard Deviation (Population) | 2.5% | 1.9% |
Similar Demographics by 7th Grade
Demographics Similar to Ghanaians by 7th Grade
In terms of 7th grade, the demographic groups most similar to Ghanaians are Immigrants from China (95.3%, a difference of 0.0%), Immigrants from Congo (95.3%, a difference of 0.0%), Korean (95.3%, a difference of 0.010%), Colombian (95.3%, a difference of 0.020%), and Somali (95.3%, a difference of 0.030%).
| Demographics | Rating | Rank | 7th Grade |
| Immigrants | Jamaica | 0.9 /100 | #251 | Tragic 95.4% |
| Immigrants | Ethiopia | 0.9 /100 | #252 | Tragic 95.3% |
| Somalis | 0.9 /100 | #253 | Tragic 95.3% |
| Colombians | 0.8 /100 | #254 | Tragic 95.3% |
| Koreans | 0.8 /100 | #255 | Tragic 95.3% |
| Immigrants | China | 0.7 /100 | #256 | Tragic 95.3% |
| Immigrants | Congo | 0.7 /100 | #257 | Tragic 95.3% |
| Ghanaians | 0.7 /100 | #258 | Tragic 95.3% |
| Immigrants | Costa Rica | 0.6 /100 | #259 | Tragic 95.3% |
| Afghans | 0.5 /100 | #260 | Tragic 95.3% |
| South Americans | 0.5 /100 | #261 | Tragic 95.2% |
| Immigrants | Somalia | 0.5 /100 | #262 | Tragic 95.2% |
| West Indians | 0.5 /100 | #263 | Tragic 95.2% |
| Immigrants | Nigeria | 0.4 /100 | #264 | Tragic 95.2% |
| Immigrants | Uruguay | 0.3 /100 | #265 | Tragic 95.2% |
Demographics Similar to Immigrants from Micronesia by 7th Grade
In terms of 7th grade, the demographic groups most similar to Immigrants from Micronesia are Liberian (95.9%, a difference of 0.0%), Panamanian (95.9%, a difference of 0.0%), Immigrants from Egypt (95.9%, a difference of 0.010%), Immigrants from Venezuela (95.9%, a difference of 0.010%), and Immigrants from Bahamas (95.9%, a difference of 0.010%).
| Demographics | Rating | Rank | 7th Grade |
| Immigrants | Spain | 38.8 /100 | #183 | Fair 96.0% |
| Sierra Leoneans | 37.5 /100 | #184 | Fair 96.0% |
| Brazilians | 37.3 /100 | #185 | Fair 96.0% |
| Immigrants | Iraq | 36.1 /100 | #186 | Fair 96.0% |
| Immigrants | Uganda | 36.0 /100 | #187 | Fair 96.0% |
| Immigrants | Egypt | 34.3 /100 | #188 | Fair 95.9% |
| Immigrants | Venezuela | 33.9 /100 | #189 | Fair 95.9% |
| Immigrants | Micronesia | 32.6 /100 | #190 | Fair 95.9% |
| Liberians | 32.5 /100 | #191 | Fair 95.9% |
| Panamanians | 32.3 /100 | #192 | Fair 95.9% |
| Immigrants | Bahamas | 30.8 /100 | #193 | Fair 95.9% |
| Immigrants | Nepal | 30.0 /100 | #194 | Fair 95.9% |
| Sudanese | 28.1 /100 | #195 | Fair 95.9% |
| Apache | 27.6 /100 | #196 | Fair 95.9% |
| Immigrants | Zaire | 26.7 /100 | #197 | Fair 95.9% |