Ghanaian vs Immigrants from Micronesia 9th Grade
COMPARE
Ghanaian
Immigrants from Micronesia
9th Grade
9th Grade Comparison
Ghanaians
Immigrants from Micronesia
93.9%
9TH GRADE
0.5/ 100
METRIC RATING
259th/ 347
METRIC RANK
94.7%
9TH GRADE
24.7/ 100
METRIC RATING
197th/ 347
METRIC RANK
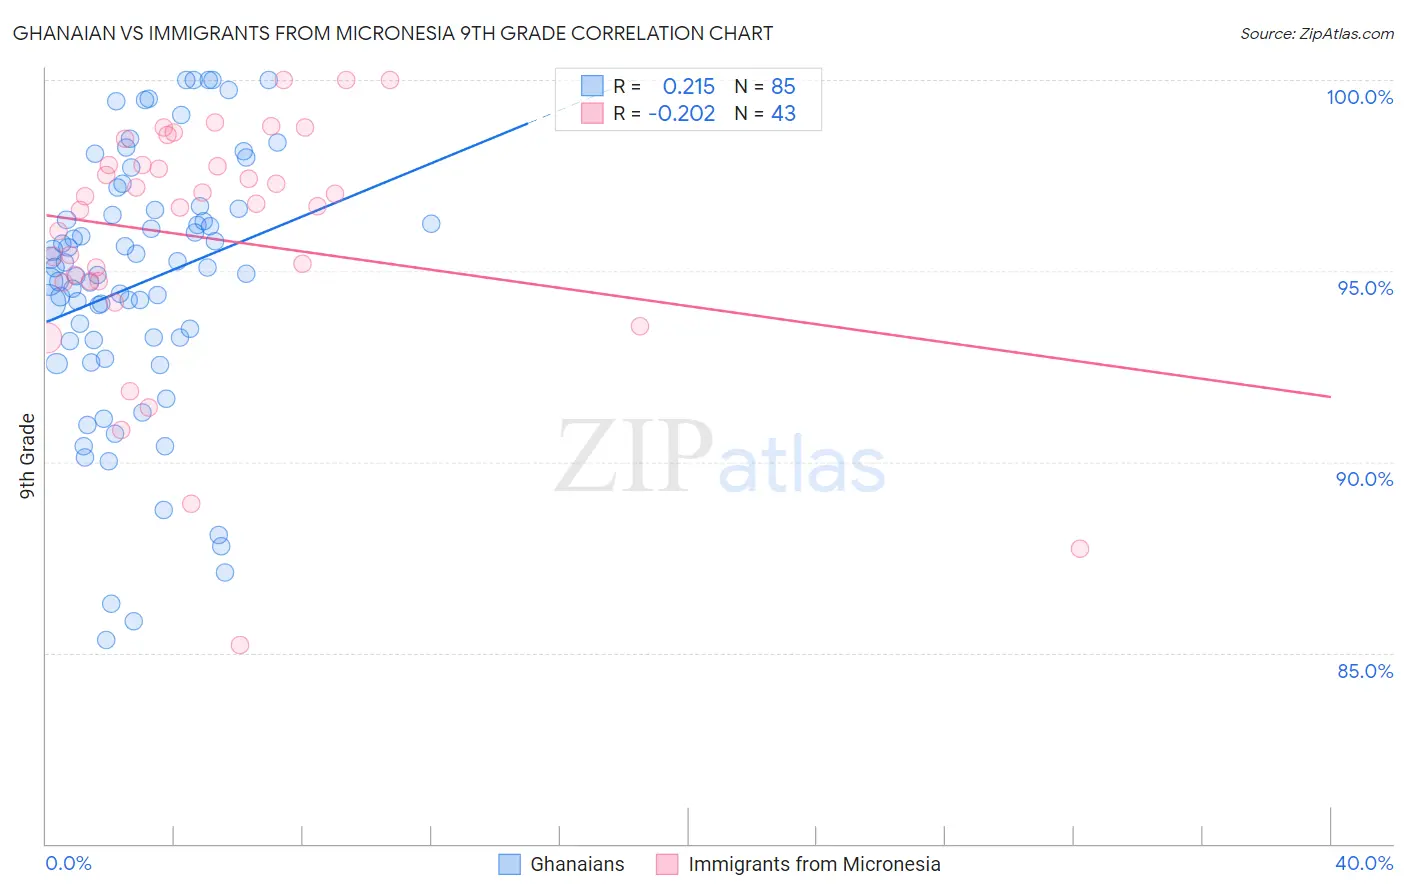
Ghanaian vs Immigrants from Micronesia 9th Grade Correlation Chart
The statistical analysis conducted on geographies consisting of 190,714,671 people shows a weak positive correlation between the proportion of Ghanaians and percentage of population with at least 9th grade education in the United States with a correlation coefficient (R) of 0.215 and weighted average of 93.9%. Similarly, the statistical analysis conducted on geographies consisting of 61,604,657 people shows a weak negative correlation between the proportion of Immigrants from Micronesia and percentage of population with at least 9th grade education in the United States with a correlation coefficient (R) of -0.202 and weighted average of 94.7%, a difference of 0.78%.
9th Grade Correlation Summary
| Measurement | Ghanaian | Immigrants from Micronesia |
| Minimum | 85.3% | 85.2% |
| Maximum | 100.0% | 100.0% |
| Range | 14.7% | 14.8% |
| Mean | 94.7% | 95.9% |
| Median | 95.1% | 96.8% |
| Interquartile 25% (IQ1) | 93.2% | 94.7% |
| Interquartile 75% (IQ3) | 96.6% | 97.8% |
| Interquartile Range (IQR) | 3.4% | 3.0% |
| Standard Deviation (Sample) | 3.4% | 3.3% |
| Standard Deviation (Population) | 3.4% | 3.2% |
Similar Demographics by 9th Grade
Demographics Similar to Ghanaians by 9th Grade
In terms of 9th grade, the demographic groups most similar to Ghanaians are Immigrants from Thailand (93.9%, a difference of 0.0%), Immigrants from Costa Rica (94.0%, a difference of 0.010%), Pima (93.9%, a difference of 0.010%), Immigrants from Afghanistan (94.0%, a difference of 0.020%), and South American (93.9%, a difference of 0.020%).
| Demographics | Rating | Rank | 9th Grade |
| Immigrants | Senegal | 0.9 /100 | #252 | Tragic 94.1% |
| Colombians | 0.8 /100 | #253 | Tragic 94.0% |
| U.S. Virgin Islanders | 0.7 /100 | #254 | Tragic 94.0% |
| Immigrants | Nigeria | 0.6 /100 | #255 | Tragic 94.0% |
| Immigrants | Afghanistan | 0.5 /100 | #256 | Tragic 94.0% |
| Immigrants | Costa Rica | 0.5 /100 | #257 | Tragic 94.0% |
| Immigrants | Thailand | 0.5 /100 | #258 | Tragic 93.9% |
| Ghanaians | 0.5 /100 | #259 | Tragic 93.9% |
| Pima | 0.4 /100 | #260 | Tragic 93.9% |
| South Americans | 0.4 /100 | #261 | Tragic 93.9% |
| Immigrants | Jamaica | 0.4 /100 | #262 | Tragic 93.9% |
| Immigrants | Uzbekistan | 0.4 /100 | #263 | Tragic 93.9% |
| Immigrants | Congo | 0.4 /100 | #264 | Tragic 93.9% |
| Natives/Alaskans | 0.4 /100 | #265 | Tragic 93.9% |
| Navajo | 0.3 /100 | #266 | Tragic 93.9% |
Demographics Similar to Immigrants from Micronesia by 9th Grade
In terms of 9th grade, the demographic groups most similar to Immigrants from Micronesia are Immigrants from Lebanon (94.7%, a difference of 0.020%), Hawaiian (94.7%, a difference of 0.020%), Marshallese (94.7%, a difference of 0.030%), Panamanian (94.7%, a difference of 0.040%), and Laotian (94.6%, a difference of 0.040%).
| Demographics | Rating | Rank | 9th Grade |
| Sudanese | 32.7 /100 | #190 | Fair 94.7% |
| Assyrians/Chaldeans/Syriacs | 32.0 /100 | #191 | Fair 94.7% |
| Immigrants | Northern Africa | 30.7 /100 | #192 | Fair 94.7% |
| Paraguayans | 30.1 /100 | #193 | Fair 94.7% |
| Panamanians | 29.0 /100 | #194 | Fair 94.7% |
| Marshallese | 27.9 /100 | #195 | Fair 94.7% |
| Immigrants | Lebanon | 27.2 /100 | #196 | Fair 94.7% |
| Immigrants | Micronesia | 24.7 /100 | #197 | Fair 94.7% |
| Hawaiians | 22.7 /100 | #198 | Fair 94.7% |
| Laotians | 21.0 /100 | #199 | Fair 94.6% |
| Immigrants | Zaire | 20.6 /100 | #200 | Fair 94.6% |
| Blacks/African Americans | 20.5 /100 | #201 | Fair 94.6% |
| Immigrants | Eastern Asia | 19.8 /100 | #202 | Poor 94.6% |
| Immigrants | Bahamas | 19.8 /100 | #203 | Poor 94.6% |
| Moroccans | 19.6 /100 | #204 | Poor 94.6% |