Ghanaian vs Creek Vision Disability
COMPARE
Ghanaian
Creek
Vision Disability
Vision Disability Comparison
Ghanaians
Creek
2.2%
VISION DISABILITY
21.8/ 100
METRIC RATING
197th/ 347
METRIC RANK
3.2%
VISION DISABILITY
0.0/ 100
METRIC RATING
340th/ 347
METRIC RANK
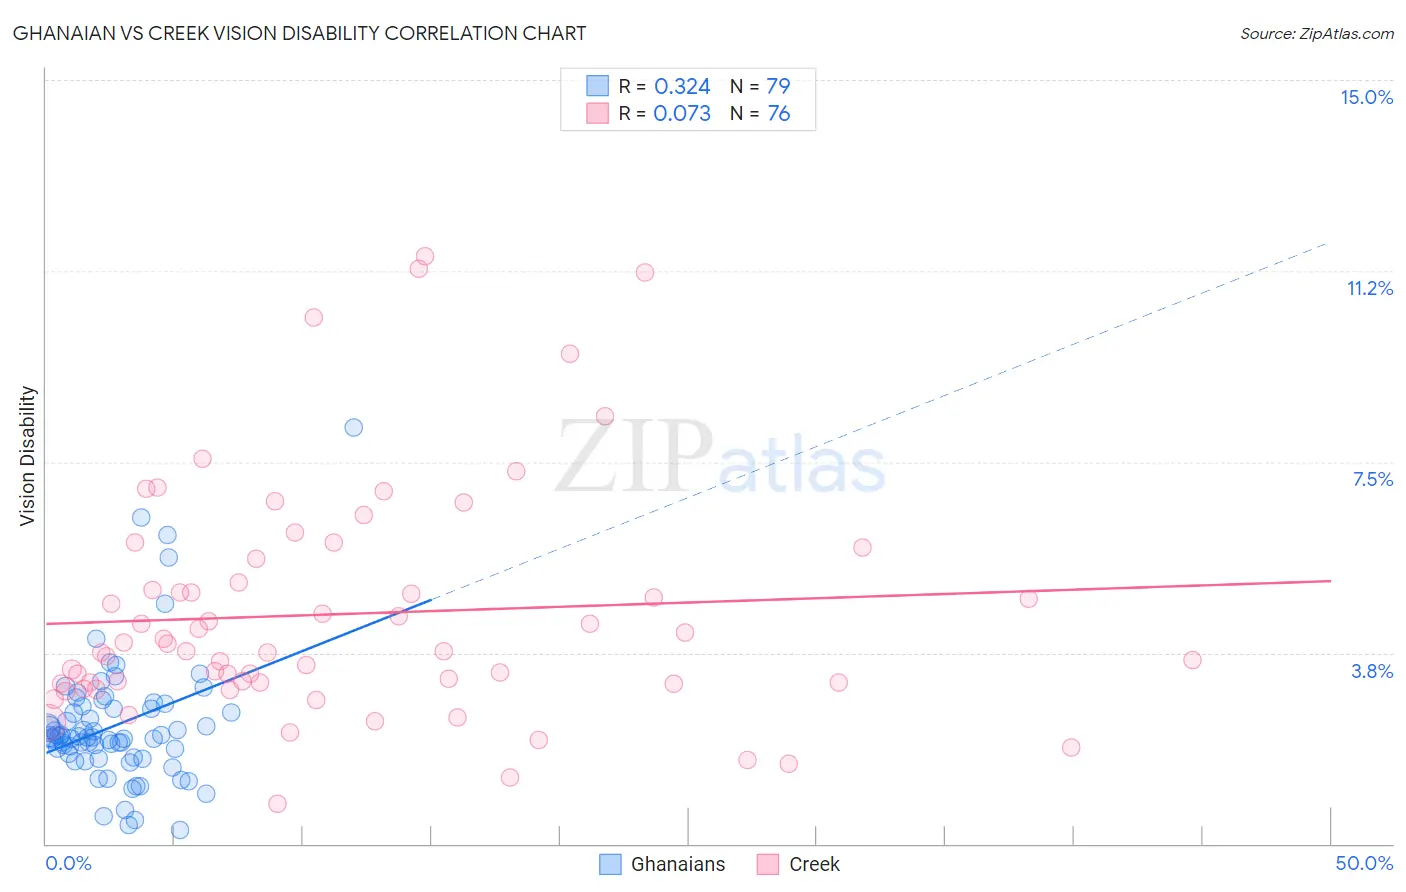
Ghanaian vs Creek Vision Disability Correlation Chart
The statistical analysis conducted on geographies consisting of 190,620,307 people shows a mild positive correlation between the proportion of Ghanaians and percentage of population with vision disability in the United States with a correlation coefficient (R) of 0.324 and weighted average of 2.2%. Similarly, the statistical analysis conducted on geographies consisting of 178,415,520 people shows a slight positive correlation between the proportion of Creek and percentage of population with vision disability in the United States with a correlation coefficient (R) of 0.073 and weighted average of 3.2%, a difference of 45.1%.
Vision Disability Correlation Summary
| Measurement | Ghanaian | Creek |
| Minimum | 0.27% | 0.78% |
| Maximum | 8.2% | 11.5% |
| Range | 7.9% | 10.8% |
| Mean | 2.3% | 4.5% |
| Median | 2.1% | 3.8% |
| Interquartile 25% (IQ1) | 1.7% | 3.2% |
| Interquartile 75% (IQ3) | 2.7% | 5.4% |
| Interquartile Range (IQR) | 1.0% | 2.2% |
| Standard Deviation (Sample) | 1.3% | 2.3% |
| Standard Deviation (Population) | 1.3% | 2.3% |
Similar Demographics by Vision Disability
Demographics Similar to Ghanaians by Vision Disability
In terms of vision disability, the demographic groups most similar to Ghanaians are Czechoslovakian (2.2%, a difference of 0.020%), Immigrants from El Salvador (2.2%, a difference of 0.070%), Immigrants from Grenada (2.2%, a difference of 0.11%), Immigrants from Thailand (2.2%, a difference of 0.16%), and Immigrants (2.2%, a difference of 0.17%).
| Demographics | Rating | Rank | Vision Disability |
| Immigrants | Costa Rica | 26.1 /100 | #190 | Fair 2.2% |
| Canadians | 25.8 /100 | #191 | Fair 2.2% |
| Europeans | 25.7 /100 | #192 | Fair 2.2% |
| British | 25.1 /100 | #193 | Fair 2.2% |
| Immigrants | Barbados | 24.0 /100 | #194 | Fair 2.2% |
| Immigrants | Immigrants | 23.7 /100 | #195 | Fair 2.2% |
| Immigrants | Grenada | 23.1 /100 | #196 | Fair 2.2% |
| Ghanaians | 21.8 /100 | #197 | Fair 2.2% |
| Czechoslovakians | 21.6 /100 | #198 | Fair 2.2% |
| Immigrants | El Salvador | 21.0 /100 | #199 | Fair 2.2% |
| Immigrants | Thailand | 20.1 /100 | #200 | Fair 2.2% |
| Slovaks | 18.8 /100 | #201 | Poor 2.2% |
| Immigrants | Zaire | 18.0 /100 | #202 | Poor 2.2% |
| Dutch | 17.1 /100 | #203 | Poor 2.2% |
| Immigrants | Guyana | 15.9 /100 | #204 | Poor 2.2% |
Demographics Similar to Creek by Vision Disability
In terms of vision disability, the demographic groups most similar to Creek are Tsimshian (3.2%, a difference of 0.13%), Chickasaw (3.2%, a difference of 0.82%), Kiowa (3.3%, a difference of 1.4%), Dutch West Indian (3.2%, a difference of 1.7%), and Alaskan Athabascan (3.1%, a difference of 1.8%).
| Demographics | Rating | Rank | Vision Disability |
| Cajuns | 0.0 /100 | #333 | Tragic 3.1% |
| Cheyenne | 0.0 /100 | #334 | Tragic 3.1% |
| Navajo | 0.0 /100 | #335 | Tragic 3.1% |
| Alaskan Athabascans | 0.0 /100 | #336 | Tragic 3.1% |
| Dutch West Indians | 0.0 /100 | #337 | Tragic 3.2% |
| Chickasaw | 0.0 /100 | #338 | Tragic 3.2% |
| Tsimshian | 0.0 /100 | #339 | Tragic 3.2% |
| Creek | 0.0 /100 | #340 | Tragic 3.2% |
| Kiowa | 0.0 /100 | #341 | Tragic 3.3% |
| Choctaw | 0.0 /100 | #342 | Tragic 3.3% |
| Pima | 0.0 /100 | #343 | Tragic 3.3% |
| Pueblo | 0.0 /100 | #344 | Tragic 3.3% |
| Lumbee | 0.0 /100 | #345 | Tragic 3.4% |
| Houma | 0.0 /100 | #346 | Tragic 3.4% |
| Puerto Ricans | 0.0 /100 | #347 | Tragic 3.9% |