Ghanaian vs Uruguayan Vision Disability
COMPARE
Ghanaian
Uruguayan
Vision Disability
Vision Disability Comparison
Ghanaians
Uruguayans
2.2%
VISION DISABILITY
21.8/ 100
METRIC RATING
197th/ 347
METRIC RANK
2.2%
VISION DISABILITY
42.7/ 100
METRIC RATING
180th/ 347
METRIC RANK
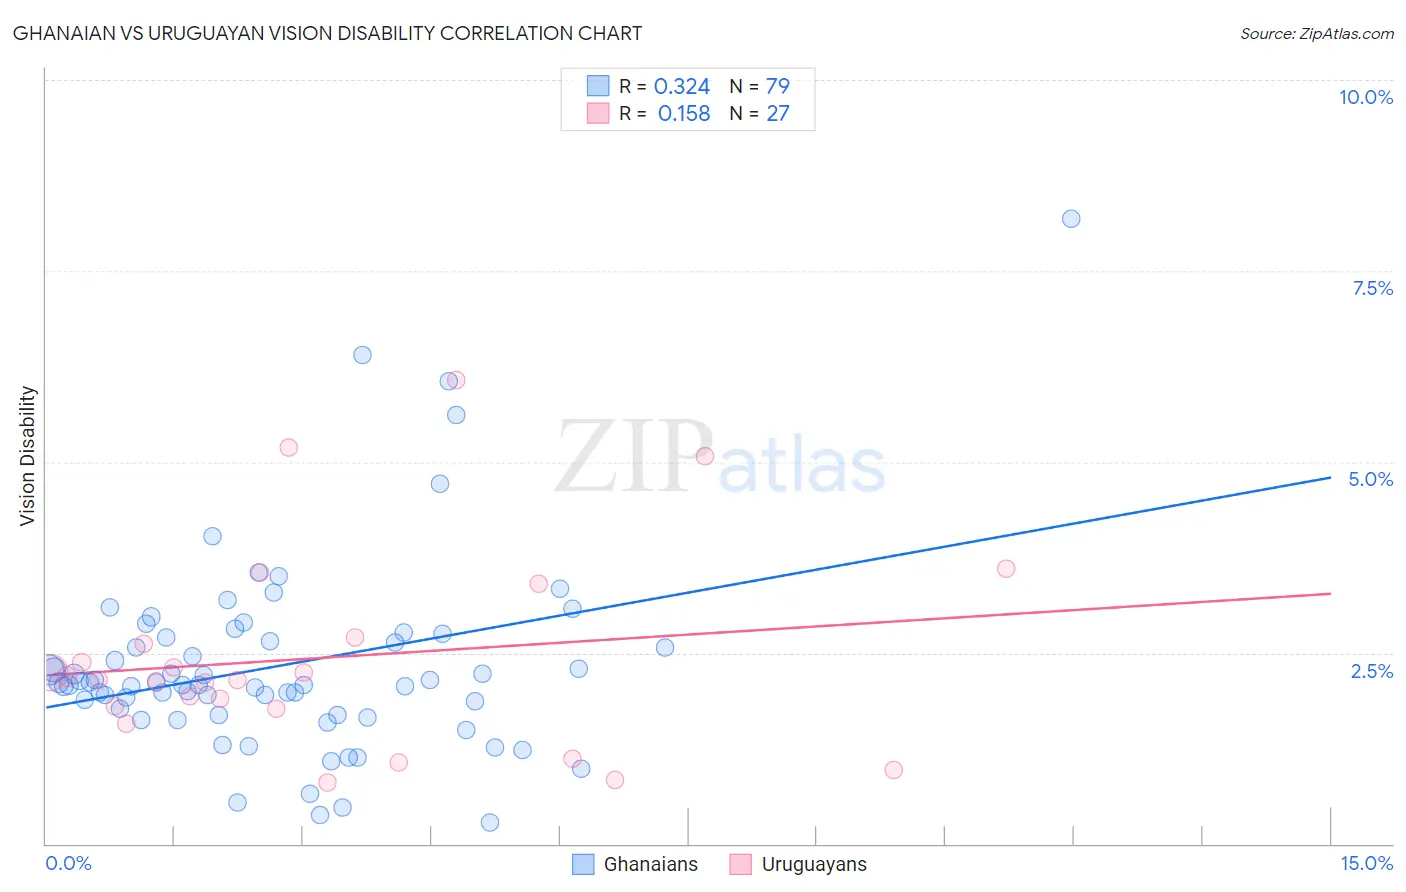
Ghanaian vs Uruguayan Vision Disability Correlation Chart
The statistical analysis conducted on geographies consisting of 190,620,307 people shows a mild positive correlation between the proportion of Ghanaians and percentage of population with vision disability in the United States with a correlation coefficient (R) of 0.324 and weighted average of 2.2%. Similarly, the statistical analysis conducted on geographies consisting of 144,772,408 people shows a poor positive correlation between the proportion of Uruguayans and percentage of population with vision disability in the United States with a correlation coefficient (R) of 0.158 and weighted average of 2.2%, a difference of 1.5%.
Vision Disability Correlation Summary
| Measurement | Ghanaian | Uruguayan |
| Minimum | 0.27% | 0.80% |
| Maximum | 8.2% | 6.1% |
| Range | 7.9% | 5.3% |
| Mean | 2.3% | 2.4% |
| Median | 2.1% | 2.1% |
| Interquartile 25% (IQ1) | 1.7% | 1.8% |
| Interquartile 75% (IQ3) | 2.7% | 2.7% |
| Interquartile Range (IQR) | 1.0% | 0.93% |
| Standard Deviation (Sample) | 1.3% | 1.3% |
| Standard Deviation (Population) | 1.3% | 1.3% |
Demographics Similar to Ghanaians and Uruguayans by Vision Disability
In terms of vision disability, the demographic groups most similar to Ghanaians are Czechoslovakian (2.2%, a difference of 0.020%), Immigrants from Grenada (2.2%, a difference of 0.11%), Immigrants (2.2%, a difference of 0.17%), Immigrants from Barbados (2.2%, a difference of 0.19%), and British (2.2%, a difference of 0.28%). Similarly, the demographic groups most similar to Uruguayans are Immigrants from Western Europe (2.2%, a difference of 0.10%), Immigrants from North America (2.2%, a difference of 0.12%), Costa Rican (2.2%, a difference of 0.13%), Immigrants from Oceania (2.2%, a difference of 0.16%), and Immigrants from Burma/Myanmar (2.2%, a difference of 0.31%).
| Demographics | Rating | Rank | Vision Disability |
| Immigrants | Oceania | 45.1 /100 | #178 | Average 2.2% |
| Immigrants | North America | 44.5 /100 | #179 | Average 2.2% |
| Uruguayans | 42.7 /100 | #180 | Average 2.2% |
| Immigrants | Western Europe | 41.1 /100 | #181 | Average 2.2% |
| Costa Ricans | 40.7 /100 | #182 | Average 2.2% |
| Immigrants | Burma/Myanmar | 37.9 /100 | #183 | Fair 2.2% |
| Moroccans | 35.4 /100 | #184 | Fair 2.2% |
| Immigrants | Middle Africa | 33.5 /100 | #185 | Fair 2.2% |
| Native Hawaiians | 33.3 /100 | #186 | Fair 2.2% |
| Immigrants | St. Vincent and the Grenadines | 30.3 /100 | #187 | Fair 2.2% |
| Guyanese | 28.9 /100 | #188 | Fair 2.2% |
| Salvadorans | 27.4 /100 | #189 | Fair 2.2% |
| Immigrants | Costa Rica | 26.1 /100 | #190 | Fair 2.2% |
| Canadians | 25.8 /100 | #191 | Fair 2.2% |
| Europeans | 25.7 /100 | #192 | Fair 2.2% |
| British | 25.1 /100 | #193 | Fair 2.2% |
| Immigrants | Barbados | 24.0 /100 | #194 | Fair 2.2% |
| Immigrants | Immigrants | 23.7 /100 | #195 | Fair 2.2% |
| Immigrants | Grenada | 23.1 /100 | #196 | Fair 2.2% |
| Ghanaians | 21.8 /100 | #197 | Fair 2.2% |
| Czechoslovakians | 21.6 /100 | #198 | Fair 2.2% |