Ghanaian vs Immigrants from Cuba Vision Disability
COMPARE
Ghanaian
Immigrants from Cuba
Vision Disability
Vision Disability Comparison
Ghanaians
Immigrants from Cuba
2.2%
VISION DISABILITY
21.8/ 100
METRIC RATING
197th/ 347
METRIC RANK
2.5%
VISION DISABILITY
0.0/ 100
METRIC RATING
290th/ 347
METRIC RANK
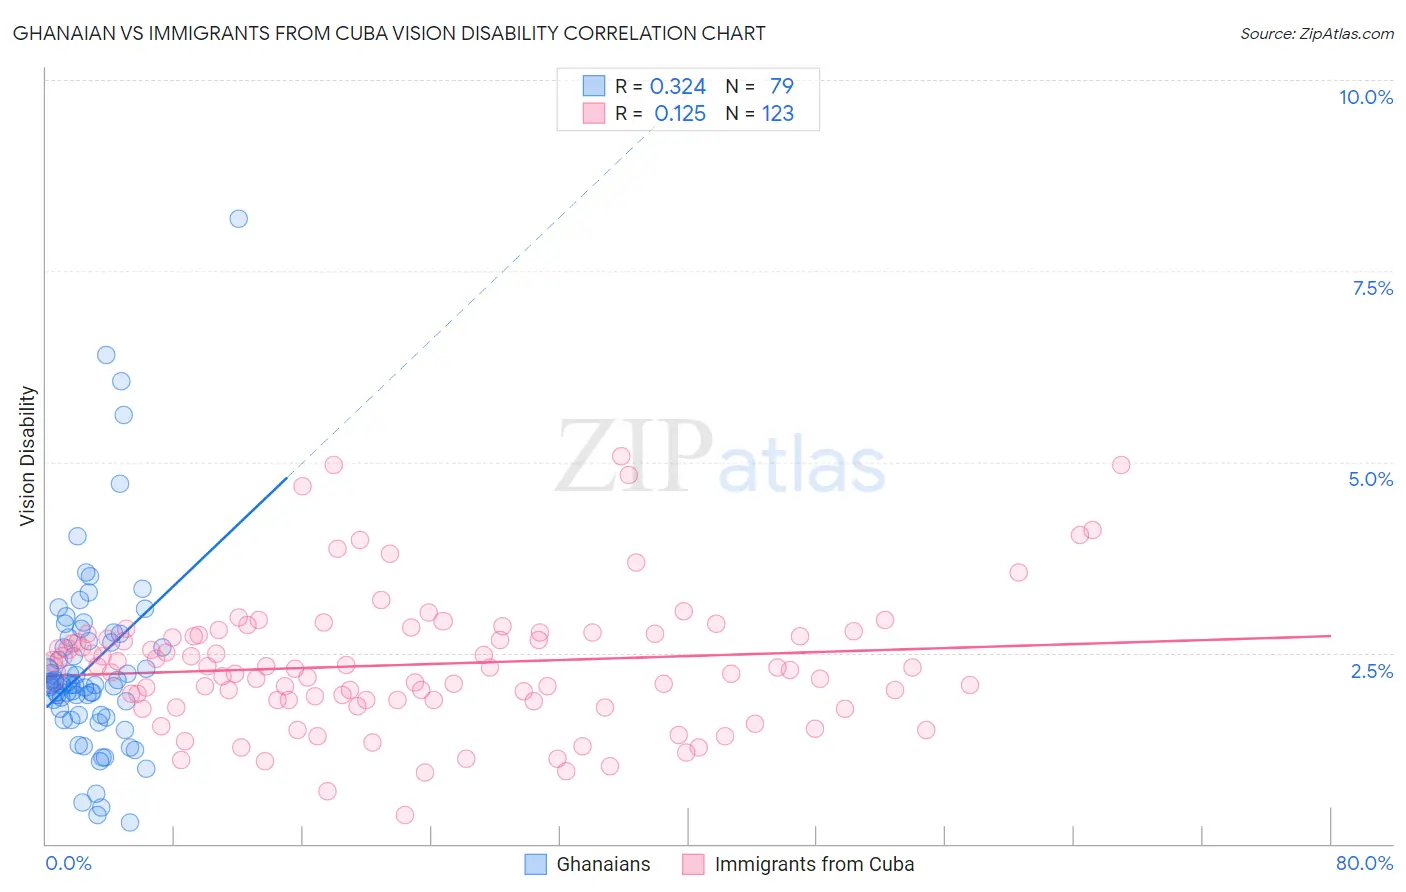
Ghanaian vs Immigrants from Cuba Vision Disability Correlation Chart
The statistical analysis conducted on geographies consisting of 190,620,307 people shows a mild positive correlation between the proportion of Ghanaians and percentage of population with vision disability in the United States with a correlation coefficient (R) of 0.324 and weighted average of 2.2%. Similarly, the statistical analysis conducted on geographies consisting of 325,877,901 people shows a poor positive correlation between the proportion of Immigrants from Cuba and percentage of population with vision disability in the United States with a correlation coefficient (R) of 0.125 and weighted average of 2.5%, a difference of 12.4%.
Vision Disability Correlation Summary
| Measurement | Ghanaian | Immigrants from Cuba |
| Minimum | 0.27% | 0.38% |
| Maximum | 8.2% | 5.1% |
| Range | 7.9% | 4.7% |
| Mean | 2.3% | 2.3% |
| Median | 2.1% | 2.3% |
| Interquartile 25% (IQ1) | 1.7% | 1.9% |
| Interquartile 75% (IQ3) | 2.7% | 2.7% |
| Interquartile Range (IQR) | 1.0% | 0.87% |
| Standard Deviation (Sample) | 1.3% | 0.87% |
| Standard Deviation (Population) | 1.3% | 0.87% |
Similar Demographics by Vision Disability
Demographics Similar to Ghanaians by Vision Disability
In terms of vision disability, the demographic groups most similar to Ghanaians are Czechoslovakian (2.2%, a difference of 0.020%), Immigrants from El Salvador (2.2%, a difference of 0.070%), Immigrants from Grenada (2.2%, a difference of 0.11%), Immigrants from Thailand (2.2%, a difference of 0.16%), and Immigrants (2.2%, a difference of 0.17%).
| Demographics | Rating | Rank | Vision Disability |
| Immigrants | Costa Rica | 26.1 /100 | #190 | Fair 2.2% |
| Canadians | 25.8 /100 | #191 | Fair 2.2% |
| Europeans | 25.7 /100 | #192 | Fair 2.2% |
| British | 25.1 /100 | #193 | Fair 2.2% |
| Immigrants | Barbados | 24.0 /100 | #194 | Fair 2.2% |
| Immigrants | Immigrants | 23.7 /100 | #195 | Fair 2.2% |
| Immigrants | Grenada | 23.1 /100 | #196 | Fair 2.2% |
| Ghanaians | 21.8 /100 | #197 | Fair 2.2% |
| Czechoslovakians | 21.6 /100 | #198 | Fair 2.2% |
| Immigrants | El Salvador | 21.0 /100 | #199 | Fair 2.2% |
| Immigrants | Thailand | 20.1 /100 | #200 | Fair 2.2% |
| Slovaks | 18.8 /100 | #201 | Poor 2.2% |
| Immigrants | Zaire | 18.0 /100 | #202 | Poor 2.2% |
| Dutch | 17.1 /100 | #203 | Poor 2.2% |
| Immigrants | Guyana | 15.9 /100 | #204 | Poor 2.2% |
Demographics Similar to Immigrants from Cuba by Vision Disability
In terms of vision disability, the demographic groups most similar to Immigrants from Cuba are Nonimmigrants (2.5%, a difference of 0.14%), Immigrants from Honduras (2.5%, a difference of 0.39%), Crow (2.5%, a difference of 0.49%), Yaqui (2.5%, a difference of 0.52%), and French American Indian (2.5%, a difference of 0.55%).
| Demographics | Rating | Rank | Vision Disability |
| Puget Sound Salish | 0.0 /100 | #283 | Tragic 2.5% |
| Yakama | 0.0 /100 | #284 | Tragic 2.5% |
| Immigrants | Central America | 0.0 /100 | #285 | Tragic 2.5% |
| Sioux | 0.0 /100 | #286 | Tragic 2.5% |
| Hondurans | 0.0 /100 | #287 | Tragic 2.5% |
| French American Indians | 0.0 /100 | #288 | Tragic 2.5% |
| Immigrants | Nonimmigrants | 0.0 /100 | #289 | Tragic 2.5% |
| Immigrants | Cuba | 0.0 /100 | #290 | Tragic 2.5% |
| Immigrants | Honduras | 0.0 /100 | #291 | Tragic 2.5% |
| Crow | 0.0 /100 | #292 | Tragic 2.5% |
| Yaqui | 0.0 /100 | #293 | Tragic 2.5% |
| Ottawa | 0.0 /100 | #294 | Tragic 2.5% |
| Delaware | 0.0 /100 | #295 | Tragic 2.5% |
| Immigrants | Mexico | 0.0 /100 | #296 | Tragic 2.5% |
| Immigrants | Dominica | 0.0 /100 | #297 | Tragic 2.5% |