Immigrants from Armenia vs Creek Vision Disability
COMPARE
Immigrants from Armenia
Creek
Vision Disability
Vision Disability Comparison
Immigrants from Armenia
Creek
2.1%
VISION DISABILITY
93.8/ 100
METRIC RATING
110th/ 347
METRIC RANK
3.2%
VISION DISABILITY
0.0/ 100
METRIC RATING
340th/ 347
METRIC RANK
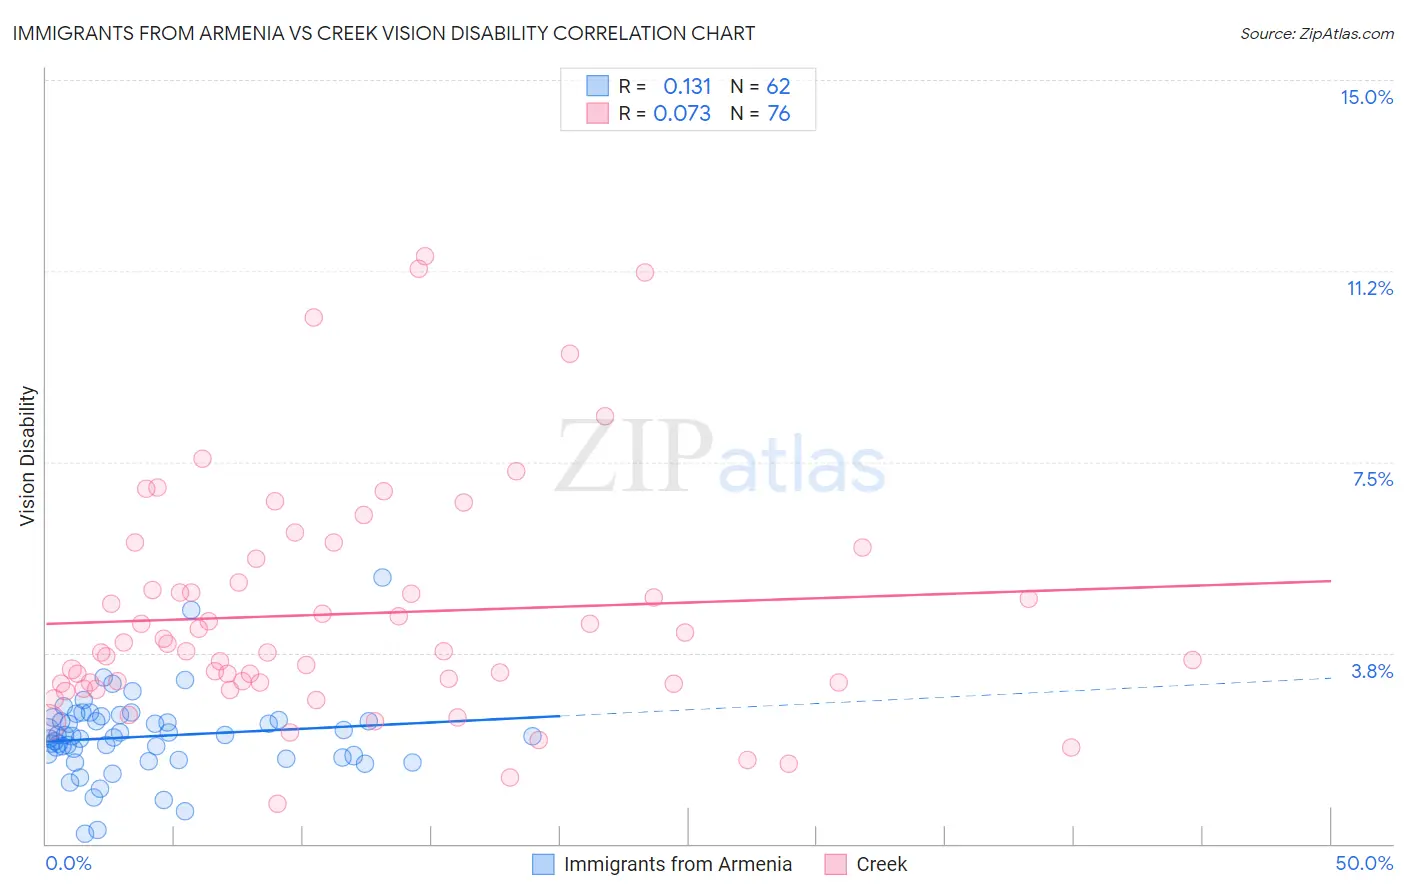
Immigrants from Armenia vs Creek Vision Disability Correlation Chart
The statistical analysis conducted on geographies consisting of 97,705,709 people shows a poor positive correlation between the proportion of Immigrants from Armenia and percentage of population with vision disability in the United States with a correlation coefficient (R) of 0.131 and weighted average of 2.1%. Similarly, the statistical analysis conducted on geographies consisting of 178,415,520 people shows a slight positive correlation between the proportion of Creek and percentage of population with vision disability in the United States with a correlation coefficient (R) of 0.073 and weighted average of 3.2%, a difference of 54.5%.
Vision Disability Correlation Summary
| Measurement | Immigrants from Armenia | Creek |
| Minimum | 0.20% | 0.78% |
| Maximum | 5.2% | 11.5% |
| Range | 5.0% | 10.8% |
| Mean | 2.1% | 4.5% |
| Median | 2.1% | 3.8% |
| Interquartile 25% (IQ1) | 1.7% | 3.2% |
| Interquartile 75% (IQ3) | 2.4% | 5.4% |
| Interquartile Range (IQR) | 0.76% | 2.2% |
| Standard Deviation (Sample) | 0.82% | 2.3% |
| Standard Deviation (Population) | 0.81% | 2.3% |
Similar Demographics by Vision Disability
Demographics Similar to Immigrants from Armenia by Vision Disability
In terms of vision disability, the demographic groups most similar to Immigrants from Armenia are Peruvian (2.1%, a difference of 0.060%), Chilean (2.1%, a difference of 0.070%), Korean (2.1%, a difference of 0.090%), Swedish (2.1%, a difference of 0.12%), and Danish (2.1%, a difference of 0.12%).
| Demographics | Rating | Rank | Vision Disability |
| Immigrants | Austria | 94.4 /100 | #103 | Exceptional 2.1% |
| Immigrants | Italy | 94.4 /100 | #104 | Exceptional 2.1% |
| Carpatho Rusyns | 94.3 /100 | #105 | Exceptional 2.1% |
| Swedes | 94.2 /100 | #106 | Exceptional 2.1% |
| Danes | 94.2 /100 | #107 | Exceptional 2.1% |
| Koreans | 94.1 /100 | #108 | Exceptional 2.1% |
| Chileans | 94.0 /100 | #109 | Exceptional 2.1% |
| Immigrants | Armenia | 93.8 /100 | #110 | Exceptional 2.1% |
| Peruvians | 93.5 /100 | #111 | Exceptional 2.1% |
| Immigrants | Denmark | 92.9 /100 | #112 | Exceptional 2.1% |
| Kenyans | 92.5 /100 | #113 | Exceptional 2.1% |
| Croatians | 92.3 /100 | #114 | Exceptional 2.1% |
| Immigrants | Vietnam | 92.2 /100 | #115 | Exceptional 2.1% |
| Ugandans | 92.2 /100 | #116 | Exceptional 2.1% |
| Poles | 92.0 /100 | #117 | Exceptional 2.1% |
Demographics Similar to Creek by Vision Disability
In terms of vision disability, the demographic groups most similar to Creek are Tsimshian (3.2%, a difference of 0.13%), Chickasaw (3.2%, a difference of 0.82%), Kiowa (3.3%, a difference of 1.4%), Dutch West Indian (3.2%, a difference of 1.7%), and Alaskan Athabascan (3.1%, a difference of 1.8%).
| Demographics | Rating | Rank | Vision Disability |
| Cajuns | 0.0 /100 | #333 | Tragic 3.1% |
| Cheyenne | 0.0 /100 | #334 | Tragic 3.1% |
| Navajo | 0.0 /100 | #335 | Tragic 3.1% |
| Alaskan Athabascans | 0.0 /100 | #336 | Tragic 3.1% |
| Dutch West Indians | 0.0 /100 | #337 | Tragic 3.2% |
| Chickasaw | 0.0 /100 | #338 | Tragic 3.2% |
| Tsimshian | 0.0 /100 | #339 | Tragic 3.2% |
| Creek | 0.0 /100 | #340 | Tragic 3.2% |
| Kiowa | 0.0 /100 | #341 | Tragic 3.3% |
| Choctaw | 0.0 /100 | #342 | Tragic 3.3% |
| Pima | 0.0 /100 | #343 | Tragic 3.3% |
| Pueblo | 0.0 /100 | #344 | Tragic 3.3% |
| Lumbee | 0.0 /100 | #345 | Tragic 3.4% |
| Houma | 0.0 /100 | #346 | Tragic 3.4% |
| Puerto Ricans | 0.0 /100 | #347 | Tragic 3.9% |