Ghanaian vs Creek Single Mother Poverty
COMPARE
Ghanaian
Creek
Single Mother Poverty
Single Mother Poverty Comparison
Ghanaians
Creek
29.4%
SINGLE MOTHER POVERTY
36.8/ 100
METRIC RATING
185th/ 347
METRIC RANK
36.7%
SINGLE MOTHER POVERTY
0.0/ 100
METRIC RATING
331st/ 347
METRIC RANK
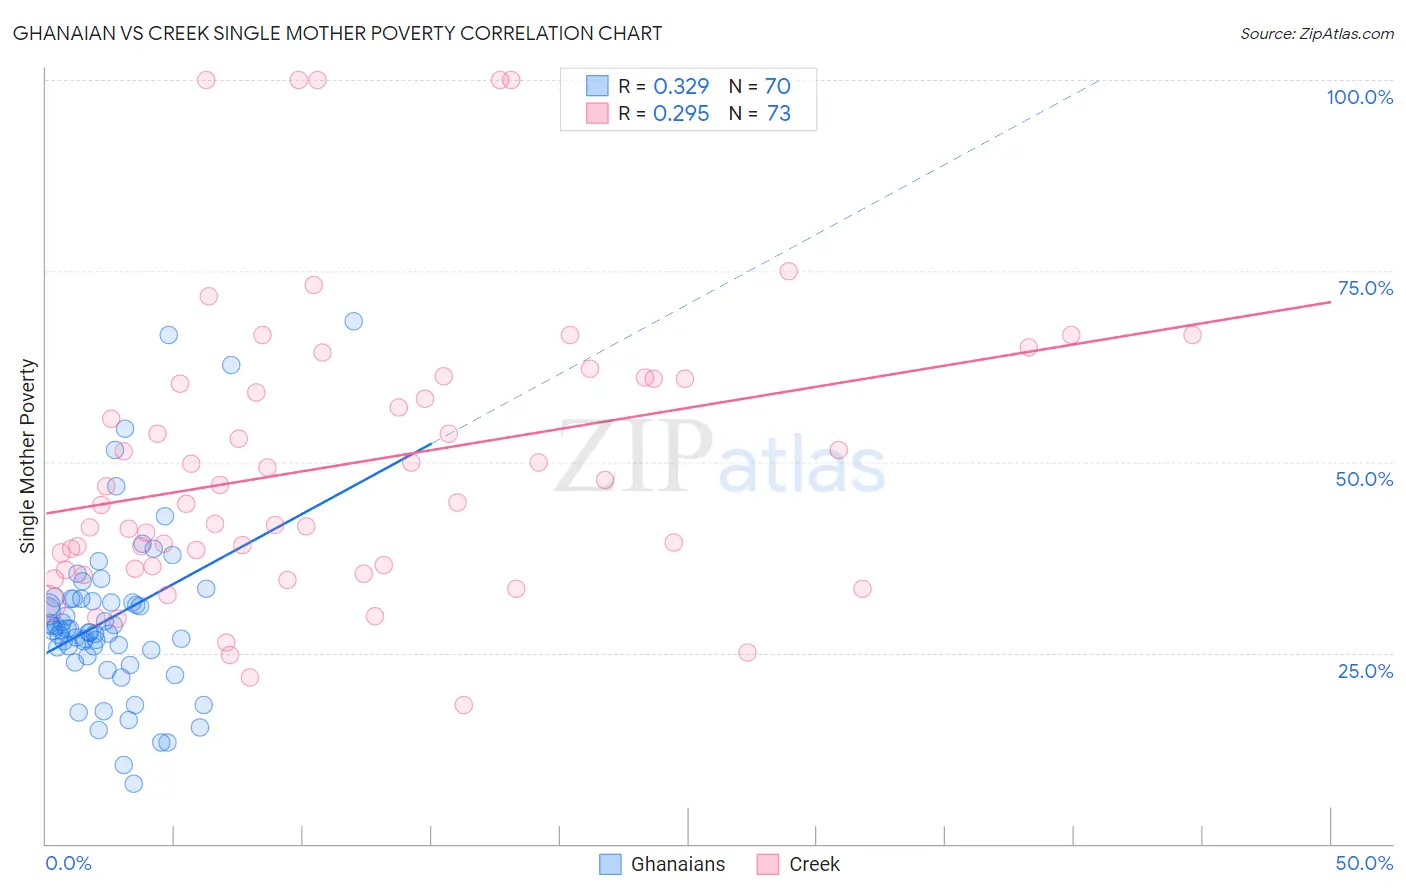
Ghanaian vs Creek Single Mother Poverty Correlation Chart
The statistical analysis conducted on geographies consisting of 188,697,723 people shows a mild positive correlation between the proportion of Ghanaians and poverty level among single mothers in the United States with a correlation coefficient (R) of 0.329 and weighted average of 29.4%. Similarly, the statistical analysis conducted on geographies consisting of 177,086,597 people shows a weak positive correlation between the proportion of Creek and poverty level among single mothers in the United States with a correlation coefficient (R) of 0.295 and weighted average of 36.7%, a difference of 25.0%.
Single Mother Poverty Correlation Summary
| Measurement | Ghanaian | Creek |
| Minimum | 7.9% | 18.2% |
| Maximum | 68.3% | 100.0% |
| Range | 60.4% | 81.8% |
| Mean | 29.6% | 49.7% |
| Median | 28.0% | 44.7% |
| Interquartile 25% (IQ1) | 25.4% | 36.1% |
| Interquartile 75% (IQ3) | 32.0% | 60.9% |
| Interquartile Range (IQR) | 6.6% | 24.8% |
| Standard Deviation (Sample) | 11.4% | 19.0% |
| Standard Deviation (Population) | 11.3% | 18.9% |
Similar Demographics by Single Mother Poverty
Demographics Similar to Ghanaians by Single Mother Poverty
In terms of single mother poverty, the demographic groups most similar to Ghanaians are Yugoslavian (29.4%, a difference of 0.040%), Nigerian (29.3%, a difference of 0.060%), Nepalese (29.3%, a difference of 0.070%), Immigrants from Eastern Africa (29.3%, a difference of 0.090%), and Canadian (29.3%, a difference of 0.18%).
| Demographics | Rating | Rank | Single Mother Poverty |
| South American Indians | 43.2 /100 | #178 | Average 29.3% |
| Immigrants | Uzbekistan | 42.6 /100 | #179 | Average 29.3% |
| Immigrants | Norway | 41.5 /100 | #180 | Average 29.3% |
| Canadians | 40.4 /100 | #181 | Average 29.3% |
| Immigrants | Eastern Africa | 38.5 /100 | #182 | Fair 29.3% |
| Nepalese | 38.3 /100 | #183 | Fair 29.3% |
| Nigerians | 38.0 /100 | #184 | Fair 29.3% |
| Ghanaians | 36.8 /100 | #185 | Fair 29.4% |
| Yugoslavians | 36.0 /100 | #186 | Fair 29.4% |
| Lebanese | 32.5 /100 | #187 | Fair 29.4% |
| Guamanians/Chamorros | 31.8 /100 | #188 | Fair 29.4% |
| Immigrants | Africa | 31.6 /100 | #189 | Fair 29.4% |
| Immigrants | Germany | 30.4 /100 | #190 | Fair 29.5% |
| Immigrants | Trinidad and Tobago | 29.2 /100 | #191 | Fair 29.5% |
| Moroccans | 28.6 /100 | #192 | Fair 29.5% |
Demographics Similar to Creek by Single Mother Poverty
In terms of single mother poverty, the demographic groups most similar to Creek are Native/Alaskan (36.6%, a difference of 0.16%), Dutch West Indian (36.8%, a difference of 0.24%), Apache (36.6%, a difference of 0.26%), Choctaw (36.4%, a difference of 0.74%), and Yakama (36.4%, a difference of 0.79%).
| Demographics | Rating | Rank | Single Mother Poverty |
| Ottawa | 0.0 /100 | #324 | Tragic 35.5% |
| Ute | 0.0 /100 | #325 | Tragic 35.7% |
| Seminole | 0.0 /100 | #326 | Tragic 35.8% |
| Yakama | 0.0 /100 | #327 | Tragic 36.4% |
| Choctaw | 0.0 /100 | #328 | Tragic 36.4% |
| Apache | 0.0 /100 | #329 | Tragic 36.6% |
| Natives/Alaskans | 0.0 /100 | #330 | Tragic 36.6% |
| Creek | 0.0 /100 | #331 | Tragic 36.7% |
| Dutch West Indians | 0.0 /100 | #332 | Tragic 36.8% |
| Menominee | 0.0 /100 | #333 | Tragic 37.1% |
| Pueblo | 0.0 /100 | #334 | Tragic 37.2% |
| Yuman | 0.0 /100 | #335 | Tragic 37.8% |
| Cheyenne | 0.0 /100 | #336 | Tragic 38.5% |
| Immigrants | Yemen | 0.0 /100 | #337 | Tragic 38.5% |
| Pima | 0.0 /100 | #338 | Tragic 38.6% |