Ghanaian vs Yup'ik Vision Disability
COMPARE
Ghanaian
Yup'ik
Vision Disability
Vision Disability Comparison
Ghanaians
Yup'ik
2.2%
VISION DISABILITY
21.8/ 100
METRIC RATING
197th/ 347
METRIC RANK
2.7%
VISION DISABILITY
0.0/ 100
METRIC RATING
317th/ 347
METRIC RANK
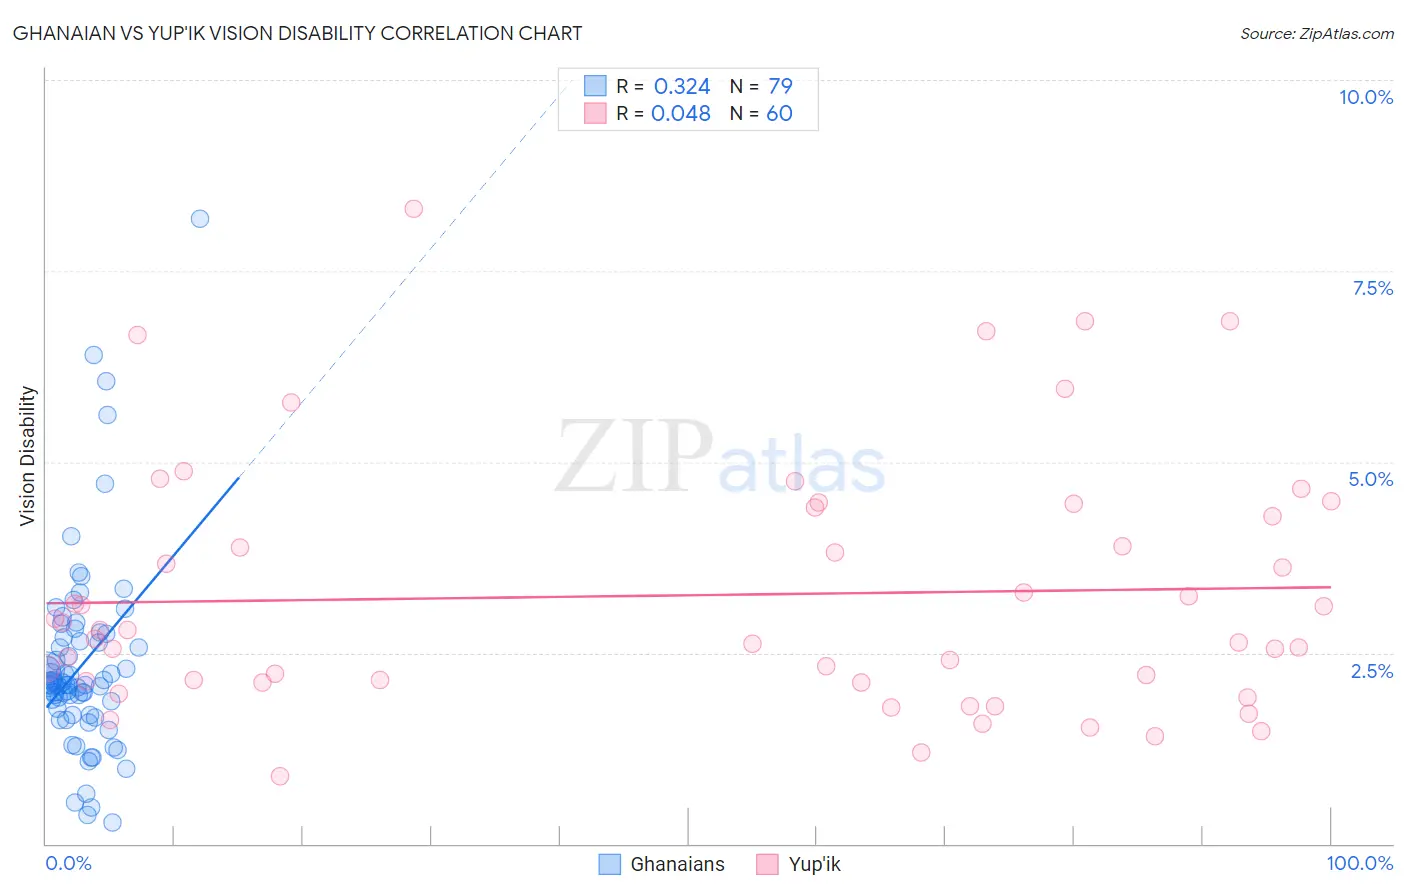
Ghanaian vs Yup'ik Vision Disability Correlation Chart
The statistical analysis conducted on geographies consisting of 190,620,307 people shows a mild positive correlation between the proportion of Ghanaians and percentage of population with vision disability in the United States with a correlation coefficient (R) of 0.324 and weighted average of 2.2%. Similarly, the statistical analysis conducted on geographies consisting of 39,951,250 people shows no correlation between the proportion of Yup'ik and percentage of population with vision disability in the United States with a correlation coefficient (R) of 0.048 and weighted average of 2.7%, a difference of 22.1%.
Vision Disability Correlation Summary
| Measurement | Ghanaian | Yup'ik |
| Minimum | 0.27% | 0.88% |
| Maximum | 8.2% | 8.3% |
| Range | 7.9% | 7.4% |
| Mean | 2.3% | 3.3% |
| Median | 2.1% | 2.7% |
| Interquartile 25% (IQ1) | 1.7% | 2.1% |
| Interquartile 75% (IQ3) | 2.7% | 4.3% |
| Interquartile Range (IQR) | 1.0% | 2.2% |
| Standard Deviation (Sample) | 1.3% | 1.6% |
| Standard Deviation (Population) | 1.3% | 1.6% |
Similar Demographics by Vision Disability
Demographics Similar to Ghanaians by Vision Disability
In terms of vision disability, the demographic groups most similar to Ghanaians are Czechoslovakian (2.2%, a difference of 0.020%), Immigrants from El Salvador (2.2%, a difference of 0.070%), Immigrants from Grenada (2.2%, a difference of 0.11%), Immigrants from Thailand (2.2%, a difference of 0.16%), and Immigrants (2.2%, a difference of 0.17%).
| Demographics | Rating | Rank | Vision Disability |
| Immigrants | Costa Rica | 26.1 /100 | #190 | Fair 2.2% |
| Canadians | 25.8 /100 | #191 | Fair 2.2% |
| Europeans | 25.7 /100 | #192 | Fair 2.2% |
| British | 25.1 /100 | #193 | Fair 2.2% |
| Immigrants | Barbados | 24.0 /100 | #194 | Fair 2.2% |
| Immigrants | Immigrants | 23.7 /100 | #195 | Fair 2.2% |
| Immigrants | Grenada | 23.1 /100 | #196 | Fair 2.2% |
| Ghanaians | 21.8 /100 | #197 | Fair 2.2% |
| Czechoslovakians | 21.6 /100 | #198 | Fair 2.2% |
| Immigrants | El Salvador | 21.0 /100 | #199 | Fair 2.2% |
| Immigrants | Thailand | 20.1 /100 | #200 | Fair 2.2% |
| Slovaks | 18.8 /100 | #201 | Poor 2.2% |
| Immigrants | Zaire | 18.0 /100 | #202 | Poor 2.2% |
| Dutch | 17.1 /100 | #203 | Poor 2.2% |
| Immigrants | Guyana | 15.9 /100 | #204 | Poor 2.2% |
Demographics Similar to Yup'ik by Vision Disability
In terms of vision disability, the demographic groups most similar to Yup'ik are Shoshone (2.7%, a difference of 0.20%), Osage (2.7%, a difference of 0.63%), Alaska Native (2.7%, a difference of 1.1%), Inupiat (2.7%, a difference of 1.8%), and Potawatomi (2.6%, a difference of 1.9%).
| Demographics | Rating | Rank | Vision Disability |
| Blackfeet | 0.0 /100 | #310 | Tragic 2.6% |
| Dominicans | 0.0 /100 | #311 | Tragic 2.6% |
| Americans | 0.0 /100 | #312 | Tragic 2.6% |
| Potawatomi | 0.0 /100 | #313 | Tragic 2.6% |
| Inupiat | 0.0 /100 | #314 | Tragic 2.7% |
| Osage | 0.0 /100 | #315 | Tragic 2.7% |
| Shoshone | 0.0 /100 | #316 | Tragic 2.7% |
| Yup'ik | 0.0 /100 | #317 | Tragic 2.7% |
| Alaska Natives | 0.0 /100 | #318 | Tragic 2.7% |
| Tohono O'odham | 0.0 /100 | #319 | Tragic 2.8% |
| Blacks/African Americans | 0.0 /100 | #320 | Tragic 2.8% |
| Comanche | 0.0 /100 | #321 | Tragic 2.8% |
| Paiute | 0.0 /100 | #322 | Tragic 2.9% |
| Tlingit-Haida | 0.0 /100 | #323 | Tragic 2.9% |
| Hopi | 0.0 /100 | #324 | Tragic 2.9% |