Ghanaian vs Immigrants from Bolivia Vision Disability
COMPARE
Ghanaian
Immigrants from Bolivia
Vision Disability
Vision Disability Comparison
Ghanaians
Immigrants from Bolivia
2.2%
VISION DISABILITY
21.8/ 100
METRIC RATING
197th/ 347
METRIC RANK
1.8%
VISION DISABILITY
100.0/ 100
METRIC RATING
15th/ 347
METRIC RANK
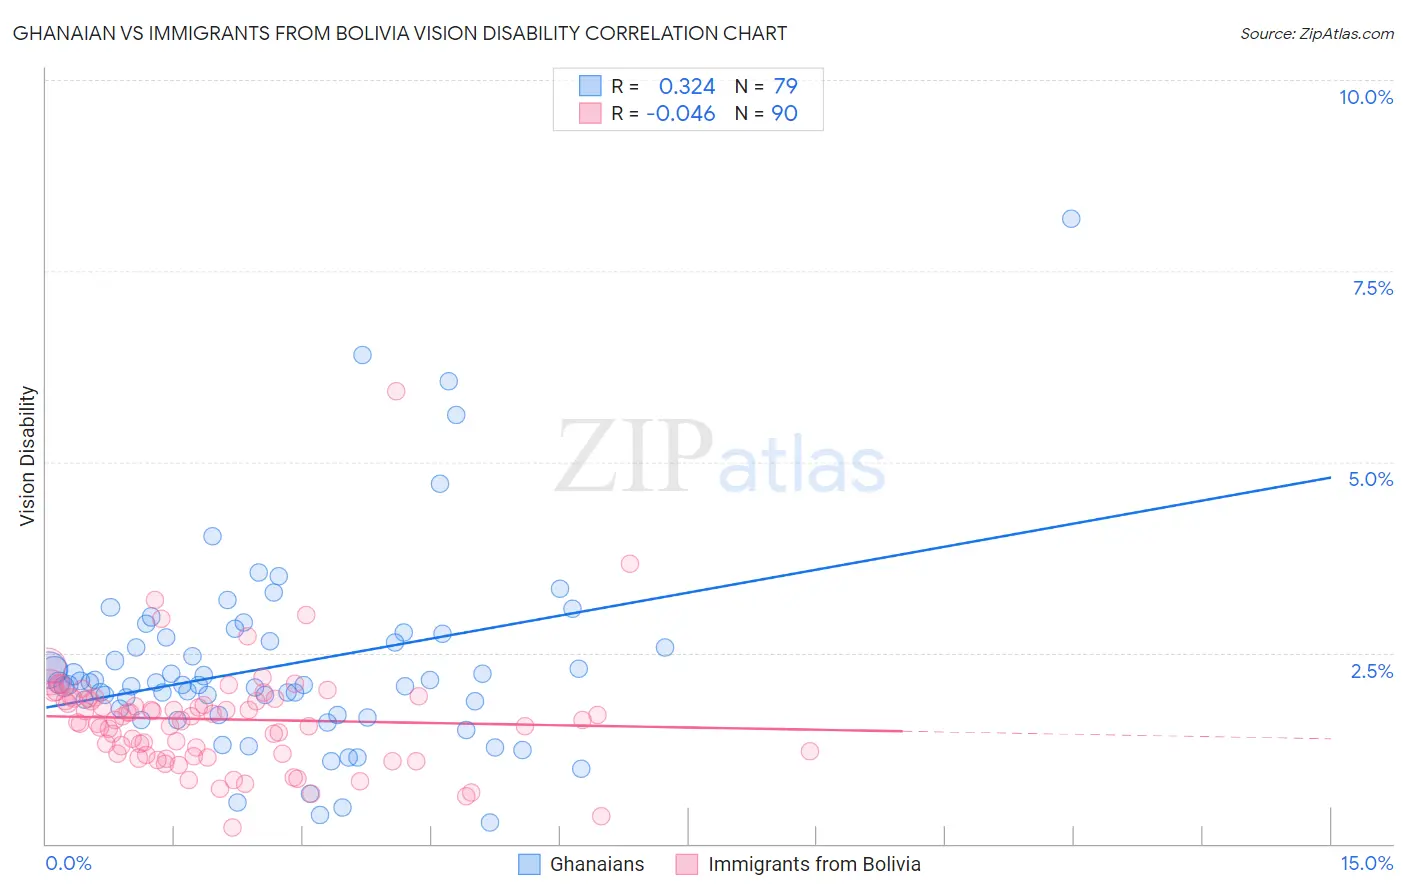
Ghanaian vs Immigrants from Bolivia Vision Disability Correlation Chart
The statistical analysis conducted on geographies consisting of 190,620,307 people shows a mild positive correlation between the proportion of Ghanaians and percentage of population with vision disability in the United States with a correlation coefficient (R) of 0.324 and weighted average of 2.2%. Similarly, the statistical analysis conducted on geographies consisting of 158,695,494 people shows no correlation between the proportion of Immigrants from Bolivia and percentage of population with vision disability in the United States with a correlation coefficient (R) of -0.046 and weighted average of 1.8%, a difference of 20.0%.
Vision Disability Correlation Summary
| Measurement | Ghanaian | Immigrants from Bolivia |
| Minimum | 0.27% | 0.21% |
| Maximum | 8.2% | 5.9% |
| Range | 7.9% | 5.7% |
| Mean | 2.3% | 1.6% |
| Median | 2.1% | 1.6% |
| Interquartile 25% (IQ1) | 1.7% | 1.2% |
| Interquartile 75% (IQ3) | 2.7% | 1.9% |
| Interquartile Range (IQR) | 1.0% | 0.72% |
| Standard Deviation (Sample) | 1.3% | 0.74% |
| Standard Deviation (Population) | 1.3% | 0.74% |
Similar Demographics by Vision Disability
Demographics Similar to Ghanaians by Vision Disability
In terms of vision disability, the demographic groups most similar to Ghanaians are Czechoslovakian (2.2%, a difference of 0.020%), Immigrants from El Salvador (2.2%, a difference of 0.070%), Immigrants from Grenada (2.2%, a difference of 0.11%), Immigrants from Thailand (2.2%, a difference of 0.16%), and Immigrants (2.2%, a difference of 0.17%).
| Demographics | Rating | Rank | Vision Disability |
| Immigrants | Costa Rica | 26.1 /100 | #190 | Fair 2.2% |
| Canadians | 25.8 /100 | #191 | Fair 2.2% |
| Europeans | 25.7 /100 | #192 | Fair 2.2% |
| British | 25.1 /100 | #193 | Fair 2.2% |
| Immigrants | Barbados | 24.0 /100 | #194 | Fair 2.2% |
| Immigrants | Immigrants | 23.7 /100 | #195 | Fair 2.2% |
| Immigrants | Grenada | 23.1 /100 | #196 | Fair 2.2% |
| Ghanaians | 21.8 /100 | #197 | Fair 2.2% |
| Czechoslovakians | 21.6 /100 | #198 | Fair 2.2% |
| Immigrants | El Salvador | 21.0 /100 | #199 | Fair 2.2% |
| Immigrants | Thailand | 20.1 /100 | #200 | Fair 2.2% |
| Slovaks | 18.8 /100 | #201 | Poor 2.2% |
| Immigrants | Zaire | 18.0 /100 | #202 | Poor 2.2% |
| Dutch | 17.1 /100 | #203 | Poor 2.2% |
| Immigrants | Guyana | 15.9 /100 | #204 | Poor 2.2% |
Demographics Similar to Immigrants from Bolivia by Vision Disability
In terms of vision disability, the demographic groups most similar to Immigrants from Bolivia are Immigrants from China (1.8%, a difference of 0.42%), Indian (Asian) (1.8%, a difference of 0.44%), Burmese (1.8%, a difference of 0.45%), Immigrants from Eastern Asia (1.8%, a difference of 0.57%), and Immigrants from Korea (1.8%, a difference of 0.65%).
| Demographics | Rating | Rank | Vision Disability |
| Iranians | 100.0 /100 | #8 | Exceptional 1.8% |
| Immigrants | Singapore | 100.0 /100 | #9 | Exceptional 1.8% |
| Immigrants | Hong Kong | 100.0 /100 | #10 | Exceptional 1.8% |
| Immigrants | Israel | 100.0 /100 | #11 | Exceptional 1.8% |
| Immigrants | Korea | 100.0 /100 | #12 | Exceptional 1.8% |
| Immigrants | Eastern Asia | 100.0 /100 | #13 | Exceptional 1.8% |
| Immigrants | China | 100.0 /100 | #14 | Exceptional 1.8% |
| Immigrants | Bolivia | 100.0 /100 | #15 | Exceptional 1.8% |
| Indians (Asian) | 100.0 /100 | #16 | Exceptional 1.8% |
| Burmese | 100.0 /100 | #17 | Exceptional 1.8% |
| Bolivians | 100.0 /100 | #18 | Exceptional 1.9% |
| Immigrants | Sri Lanka | 100.0 /100 | #19 | Exceptional 1.9% |
| Asians | 100.0 /100 | #20 | Exceptional 1.9% |
| Turks | 100.0 /100 | #21 | Exceptional 1.9% |
| Immigrants | Pakistan | 100.0 /100 | #22 | Exceptional 1.9% |