Immigrants from Taiwan vs Creek Vision Disability
COMPARE
Immigrants from Taiwan
Creek
Vision Disability
Vision Disability Comparison
Immigrants from Taiwan
Creek
1.7%
VISION DISABILITY
100.0/ 100
METRIC RATING
3rd/ 347
METRIC RANK
3.2%
VISION DISABILITY
0.0/ 100
METRIC RATING
340th/ 347
METRIC RANK
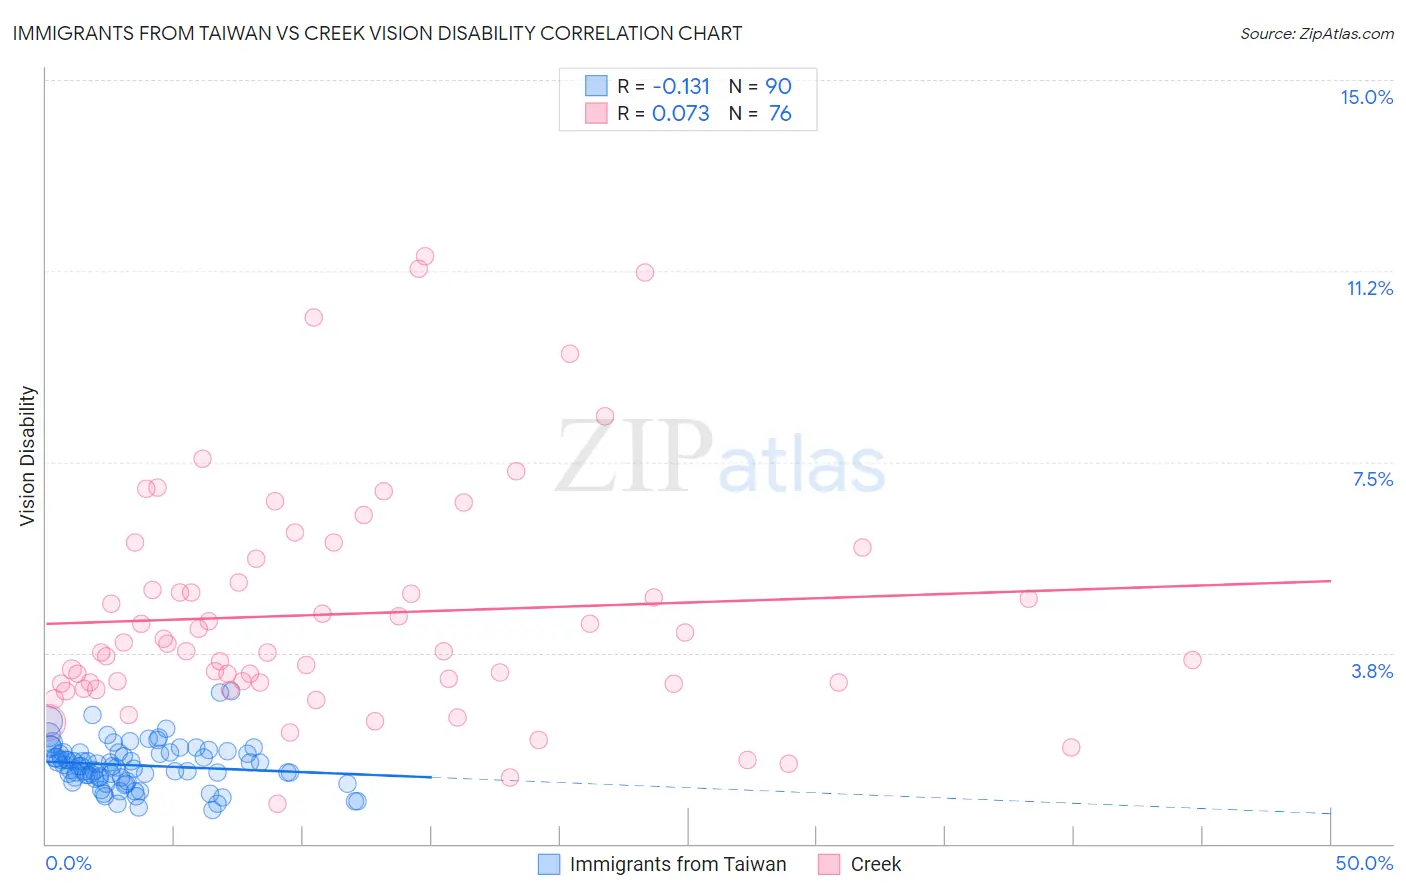
Immigrants from Taiwan vs Creek Vision Disability Correlation Chart
The statistical analysis conducted on geographies consisting of 298,112,915 people shows a poor negative correlation between the proportion of Immigrants from Taiwan and percentage of population with vision disability in the United States with a correlation coefficient (R) of -0.131 and weighted average of 1.7%. Similarly, the statistical analysis conducted on geographies consisting of 178,415,520 people shows a slight positive correlation between the proportion of Creek and percentage of population with vision disability in the United States with a correlation coefficient (R) of 0.073 and weighted average of 3.2%, a difference of 89.0%.
Vision Disability Correlation Summary
| Measurement | Immigrants from Taiwan | Creek |
| Minimum | 0.66% | 0.78% |
| Maximum | 3.0% | 11.5% |
| Range | 2.3% | 10.8% |
| Mean | 1.5% | 4.5% |
| Median | 1.5% | 3.8% |
| Interquartile 25% (IQ1) | 1.3% | 3.2% |
| Interquartile 75% (IQ3) | 1.8% | 5.4% |
| Interquartile Range (IQR) | 0.49% | 2.2% |
| Standard Deviation (Sample) | 0.44% | 2.3% |
| Standard Deviation (Population) | 0.44% | 2.3% |
Similar Demographics by Vision Disability
Demographics Similar to Immigrants from Taiwan by Vision Disability
In terms of vision disability, the demographic groups most similar to Immigrants from Taiwan are Filipino (1.7%, a difference of 0.65%), Immigrants from India (1.7%, a difference of 0.71%), Thai (1.7%, a difference of 2.6%), Okinawan (1.8%, a difference of 4.6%), and Immigrants from Iran (1.8%, a difference of 5.2%).
| Demographics | Rating | Rank | Vision Disability |
| Immigrants | India | 100.0 /100 | #1 | Exceptional 1.7% |
| Filipinos | 100.0 /100 | #2 | Exceptional 1.7% |
| Immigrants | Taiwan | 100.0 /100 | #3 | Exceptional 1.7% |
| Thais | 100.0 /100 | #4 | Exceptional 1.7% |
| Okinawans | 100.0 /100 | #5 | Exceptional 1.8% |
| Immigrants | Iran | 100.0 /100 | #6 | Exceptional 1.8% |
| Immigrants | South Central Asia | 100.0 /100 | #7 | Exceptional 1.8% |
| Iranians | 100.0 /100 | #8 | Exceptional 1.8% |
| Immigrants | Singapore | 100.0 /100 | #9 | Exceptional 1.8% |
| Immigrants | Hong Kong | 100.0 /100 | #10 | Exceptional 1.8% |
| Immigrants | Israel | 100.0 /100 | #11 | Exceptional 1.8% |
| Immigrants | Korea | 100.0 /100 | #12 | Exceptional 1.8% |
| Immigrants | Eastern Asia | 100.0 /100 | #13 | Exceptional 1.8% |
| Immigrants | China | 100.0 /100 | #14 | Exceptional 1.8% |
| Immigrants | Bolivia | 100.0 /100 | #15 | Exceptional 1.8% |
Demographics Similar to Creek by Vision Disability
In terms of vision disability, the demographic groups most similar to Creek are Tsimshian (3.2%, a difference of 0.13%), Chickasaw (3.2%, a difference of 0.82%), Kiowa (3.3%, a difference of 1.4%), Dutch West Indian (3.2%, a difference of 1.7%), and Alaskan Athabascan (3.1%, a difference of 1.8%).
| Demographics | Rating | Rank | Vision Disability |
| Cajuns | 0.0 /100 | #333 | Tragic 3.1% |
| Cheyenne | 0.0 /100 | #334 | Tragic 3.1% |
| Navajo | 0.0 /100 | #335 | Tragic 3.1% |
| Alaskan Athabascans | 0.0 /100 | #336 | Tragic 3.1% |
| Dutch West Indians | 0.0 /100 | #337 | Tragic 3.2% |
| Chickasaw | 0.0 /100 | #338 | Tragic 3.2% |
| Tsimshian | 0.0 /100 | #339 | Tragic 3.2% |
| Creek | 0.0 /100 | #340 | Tragic 3.2% |
| Kiowa | 0.0 /100 | #341 | Tragic 3.3% |
| Choctaw | 0.0 /100 | #342 | Tragic 3.3% |
| Pima | 0.0 /100 | #343 | Tragic 3.3% |
| Pueblo | 0.0 /100 | #344 | Tragic 3.3% |
| Lumbee | 0.0 /100 | #345 | Tragic 3.4% |
| Houma | 0.0 /100 | #346 | Tragic 3.4% |
| Puerto Ricans | 0.0 /100 | #347 | Tragic 3.9% |