Czech vs Soviet Union Disability Age Under 5
COMPARE
Czech
Soviet Union
Disability Age Under 5
Disability Age Under 5 Comparison
Czechs
Soviet Union
1.5%
DISABILITY AGE UNDER 5
0.0/ 100
METRIC RATING
290th/ 347
METRIC RANK
0.95%
DISABILITY AGE UNDER 5
100.0/ 100
METRIC RATING
13th/ 347
METRIC RANK
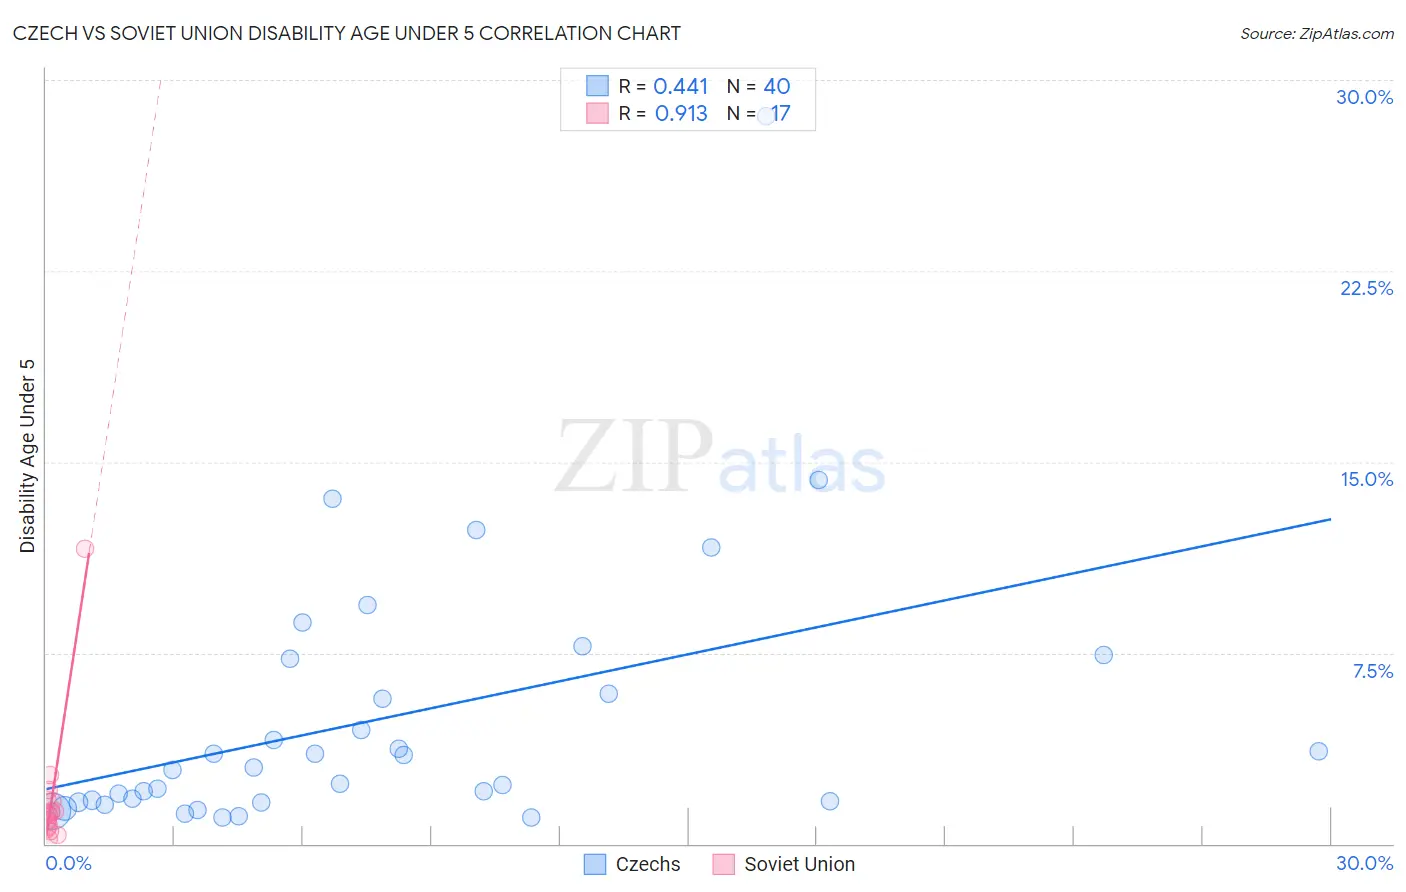
Czech vs Soviet Union Disability Age Under 5 Correlation Chart
The statistical analysis conducted on geographies consisting of 237,038,678 people shows a moderate positive correlation between the proportion of Czechs and percentage of population with a disability under the age of 5 in the United States with a correlation coefficient (R) of 0.441 and weighted average of 1.5%. Similarly, the statistical analysis conducted on geographies consisting of 37,806,626 people shows a near-perfect positive correlation between the proportion of Soviet Union and percentage of population with a disability under the age of 5 in the United States with a correlation coefficient (R) of 0.913 and weighted average of 0.95%, a difference of 63.9%.
Disability Age Under 5 Correlation Summary
| Measurement | Czech | Soviet Union |
| Minimum | 1.0% | 0.19% |
| Maximum | 28.6% | 11.6% |
| Range | 27.5% | 11.4% |
| Mean | 4.9% | 1.8% |
| Median | 2.9% | 1.2% |
| Interquartile 25% (IQ1) | 1.7% | 0.64% |
| Interquartile 75% (IQ3) | 6.6% | 1.7% |
| Interquartile Range (IQR) | 4.9% | 1.0% |
| Standard Deviation (Sample) | 5.3% | 2.6% |
| Standard Deviation (Population) | 5.2% | 2.5% |
Similar Demographics by Disability Age Under 5
Demographics Similar to Czechs by Disability Age Under 5
In terms of disability age under 5, the demographic groups most similar to Czechs are Northern European (1.6%, a difference of 0.10%), Hungarian (1.5%, a difference of 0.13%), Italian (1.6%, a difference of 0.24%), Estonian (1.5%, a difference of 0.26%), and Scandinavian (1.5%, a difference of 0.45%).
| Demographics | Rating | Rank | Disability Age Under 5 |
| Delaware | 0.0 /100 | #283 | Tragic 1.5% |
| Europeans | 0.0 /100 | #284 | Tragic 1.5% |
| Croatians | 0.0 /100 | #285 | Tragic 1.5% |
| Tlingit-Haida | 0.0 /100 | #286 | Tragic 1.5% |
| Scandinavians | 0.0 /100 | #287 | Tragic 1.5% |
| Estonians | 0.0 /100 | #288 | Tragic 1.5% |
| Hungarians | 0.0 /100 | #289 | Tragic 1.5% |
| Czechs | 0.0 /100 | #290 | Tragic 1.5% |
| Northern Europeans | 0.0 /100 | #291 | Tragic 1.6% |
| Italians | 0.0 /100 | #292 | Tragic 1.6% |
| Lithuanians | 0.0 /100 | #293 | Tragic 1.6% |
| Swedes | 0.0 /100 | #294 | Tragic 1.6% |
| Finns | 0.0 /100 | #295 | Tragic 1.6% |
| Poles | 0.0 /100 | #296 | Tragic 1.6% |
| Immigrants | Nonimmigrants | 0.0 /100 | #297 | Tragic 1.6% |
Demographics Similar to Soviet Union by Disability Age Under 5
In terms of disability age under 5, the demographic groups most similar to Soviet Union are Yuman (0.95%, a difference of 0.080%), Immigrants from Hong Kong (0.95%, a difference of 0.11%), Immigrants from Grenada (0.94%, a difference of 0.17%), Afghan (0.94%, a difference of 0.19%), and Marshallese (0.94%, a difference of 0.95%).
| Demographics | Rating | Rank | Disability Age Under 5 |
| Ute | 100.0 /100 | #6 | Exceptional 0.86% |
| Immigrants | Afghanistan | 100.0 /100 | #7 | Exceptional 0.91% |
| Immigrants | Yemen | 100.0 /100 | #8 | Exceptional 0.91% |
| Immigrants | Fiji | 100.0 /100 | #9 | Exceptional 0.92% |
| Marshallese | 100.0 /100 | #10 | Exceptional 0.94% |
| Afghans | 100.0 /100 | #11 | Exceptional 0.94% |
| Immigrants | Grenada | 100.0 /100 | #12 | Exceptional 0.94% |
| Soviet Union | 100.0 /100 | #13 | Exceptional 0.95% |
| Yuman | 100.0 /100 | #14 | Exceptional 0.95% |
| Immigrants | Hong Kong | 100.0 /100 | #15 | Exceptional 0.95% |
| Immigrants | Israel | 100.0 /100 | #16 | Exceptional 0.96% |
| Immigrants | China | 100.0 /100 | #17 | Exceptional 0.96% |
| Immigrants | Barbados | 100.0 /100 | #18 | Exceptional 0.97% |
| Puget Sound Salish | 100.0 /100 | #19 | Exceptional 0.97% |
| Nepalese | 100.0 /100 | #20 | Exceptional 0.97% |