Czech vs Cree Disability Age Under 5
COMPARE
Czech
Cree
Disability Age Under 5
Disability Age Under 5 Comparison
Czechs
Cree
1.5%
DISABILITY AGE UNDER 5
0.0/ 100
METRIC RATING
290th/ 347
METRIC RANK
1.4%
DISABILITY AGE UNDER 5
0.1/ 100
METRIC RATING
267th/ 347
METRIC RANK
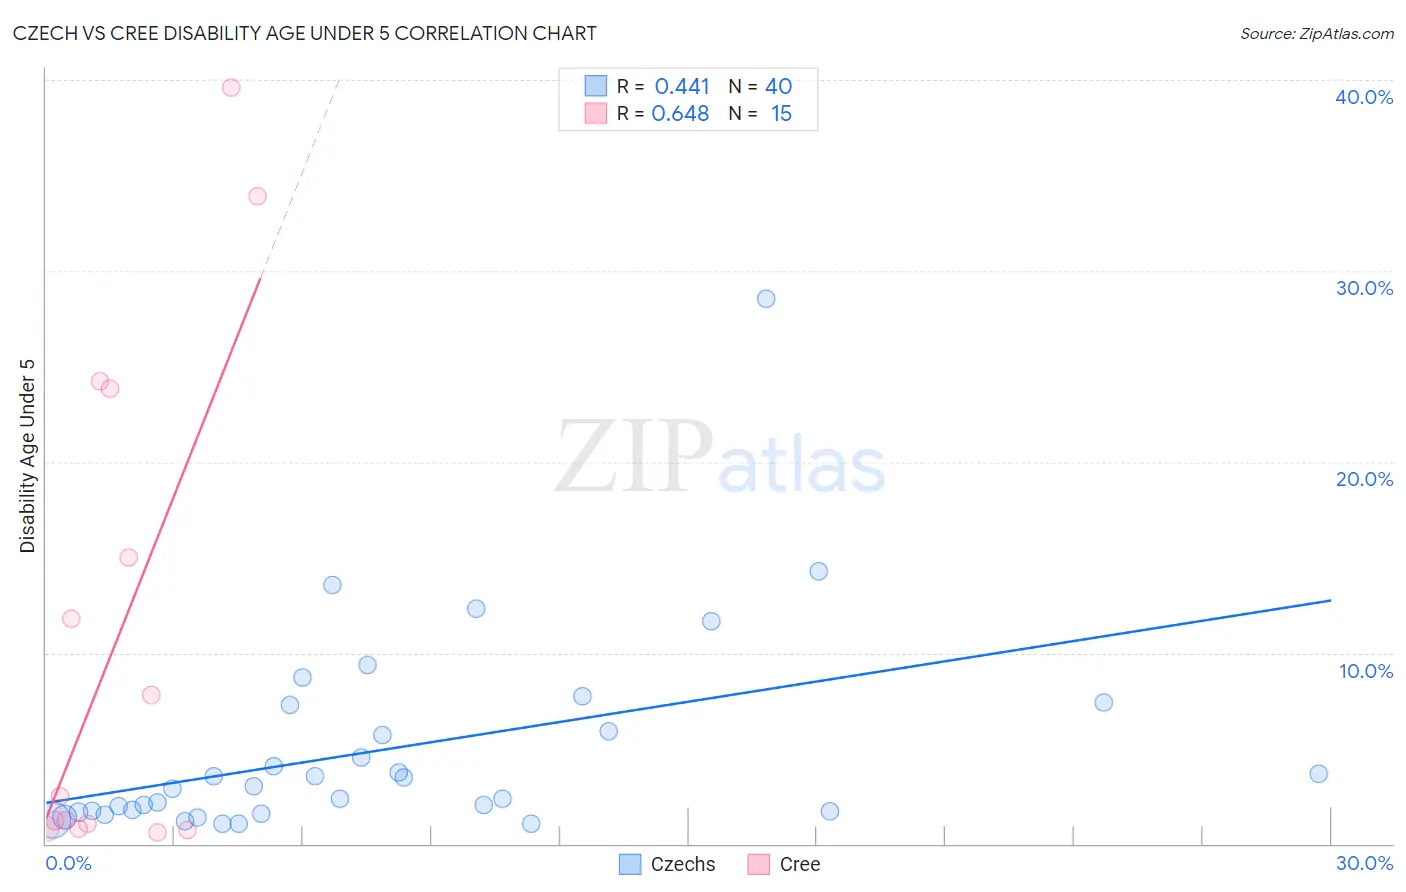
Czech vs Cree Disability Age Under 5 Correlation Chart
The statistical analysis conducted on geographies consisting of 237,038,678 people shows a moderate positive correlation between the proportion of Czechs and percentage of population with a disability under the age of 5 in the United States with a correlation coefficient (R) of 0.441 and weighted average of 1.5%. Similarly, the statistical analysis conducted on geographies consisting of 59,931,307 people shows a significant positive correlation between the proportion of Cree and percentage of population with a disability under the age of 5 in the United States with a correlation coefficient (R) of 0.648 and weighted average of 1.4%, a difference of 8.3%.
Disability Age Under 5 Correlation Summary
| Measurement | Czech | Cree |
| Minimum | 1.0% | 0.57% |
| Maximum | 28.6% | 39.6% |
| Range | 27.5% | 39.0% |
| Mean | 4.9% | 11.0% |
| Median | 2.9% | 2.5% |
| Interquartile 25% (IQ1) | 1.7% | 0.80% |
| Interquartile 75% (IQ3) | 6.6% | 23.8% |
| Interquartile Range (IQR) | 4.9% | 23.0% |
| Standard Deviation (Sample) | 5.3% | 13.3% |
| Standard Deviation (Population) | 5.2% | 12.9% |
Similar Demographics by Disability Age Under 5
Demographics Similar to Czechs by Disability Age Under 5
In terms of disability age under 5, the demographic groups most similar to Czechs are Northern European (1.6%, a difference of 0.10%), Hungarian (1.5%, a difference of 0.13%), Italian (1.6%, a difference of 0.24%), Estonian (1.5%, a difference of 0.26%), and Scandinavian (1.5%, a difference of 0.45%).
| Demographics | Rating | Rank | Disability Age Under 5 |
| Delaware | 0.0 /100 | #283 | Tragic 1.5% |
| Europeans | 0.0 /100 | #284 | Tragic 1.5% |
| Croatians | 0.0 /100 | #285 | Tragic 1.5% |
| Tlingit-Haida | 0.0 /100 | #286 | Tragic 1.5% |
| Scandinavians | 0.0 /100 | #287 | Tragic 1.5% |
| Estonians | 0.0 /100 | #288 | Tragic 1.5% |
| Hungarians | 0.0 /100 | #289 | Tragic 1.5% |
| Czechs | 0.0 /100 | #290 | Tragic 1.5% |
| Northern Europeans | 0.0 /100 | #291 | Tragic 1.6% |
| Italians | 0.0 /100 | #292 | Tragic 1.6% |
| Lithuanians | 0.0 /100 | #293 | Tragic 1.6% |
| Swedes | 0.0 /100 | #294 | Tragic 1.6% |
| Finns | 0.0 /100 | #295 | Tragic 1.6% |
| Poles | 0.0 /100 | #296 | Tragic 1.6% |
| Immigrants | Nonimmigrants | 0.0 /100 | #297 | Tragic 1.6% |
Demographics Similar to Cree by Disability Age Under 5
In terms of disability age under 5, the demographic groups most similar to Cree are Immigrants from Germany (1.4%, a difference of 0.52%), Carpatho Rusyn (1.4%, a difference of 0.55%), Belgian (1.4%, a difference of 0.58%), Yugoslavian (1.4%, a difference of 0.60%), and Spanish (1.4%, a difference of 0.75%).
| Demographics | Rating | Rank | Disability Age Under 5 |
| Slavs | 0.3 /100 | #260 | Tragic 1.4% |
| Immigrants | Netherlands | 0.2 /100 | #261 | Tragic 1.4% |
| Immigrants | Dominica | 0.2 /100 | #262 | Tragic 1.4% |
| Spanish | 0.2 /100 | #263 | Tragic 1.4% |
| Yugoslavians | 0.1 /100 | #264 | Tragic 1.4% |
| Carpatho Rusyns | 0.1 /100 | #265 | Tragic 1.4% |
| Immigrants | Germany | 0.1 /100 | #266 | Tragic 1.4% |
| Cree | 0.1 /100 | #267 | Tragic 1.4% |
| Belgians | 0.1 /100 | #268 | Tragic 1.4% |
| Austrians | 0.1 /100 | #269 | Tragic 1.4% |
| Immigrants | North America | 0.1 /100 | #270 | Tragic 1.4% |
| Immigrants | Canada | 0.1 /100 | #271 | Tragic 1.4% |
| Blacks/African Americans | 0.1 /100 | #272 | Tragic 1.4% |
| Alaskan Athabascans | 0.1 /100 | #273 | Tragic 1.5% |
| Iroquois | 0.0 /100 | #274 | Tragic 1.5% |