Czech vs Syrian Disability Age Under 5
COMPARE
Czech
Syrian
Disability Age Under 5
Disability Age Under 5 Comparison
Czechs
Syrians
1.5%
DISABILITY AGE UNDER 5
0.0/ 100
METRIC RATING
290th/ 347
METRIC RANK
1.3%
DISABILITY AGE UNDER 5
16.1/ 100
METRIC RATING
215th/ 347
METRIC RANK
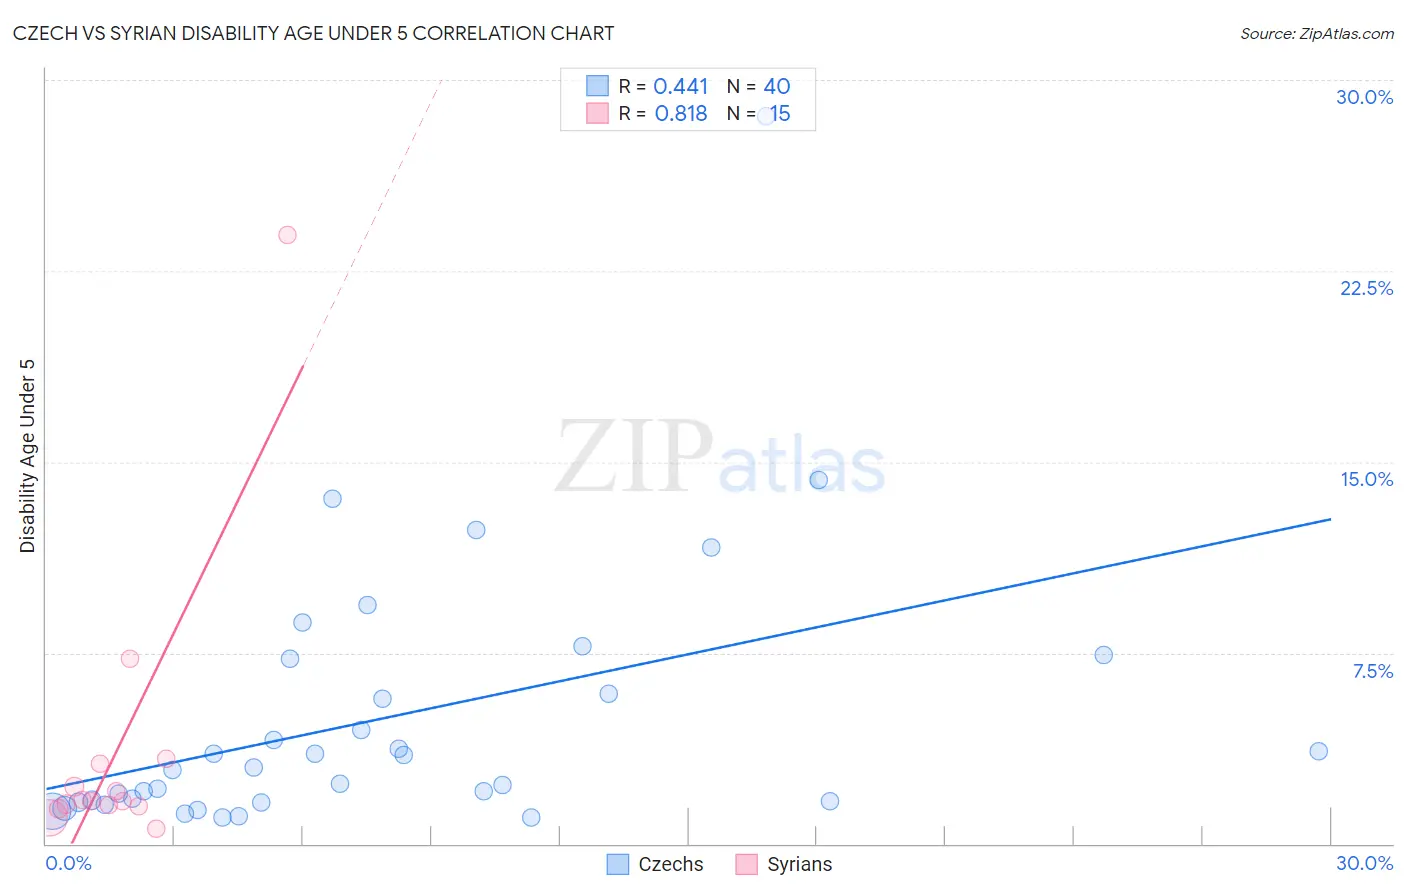
Czech vs Syrian Disability Age Under 5 Correlation Chart
The statistical analysis conducted on geographies consisting of 237,038,678 people shows a moderate positive correlation between the proportion of Czechs and percentage of population with a disability under the age of 5 in the United States with a correlation coefficient (R) of 0.441 and weighted average of 1.5%. Similarly, the statistical analysis conducted on geographies consisting of 161,568,147 people shows a very strong positive correlation between the proportion of Syrians and percentage of population with a disability under the age of 5 in the United States with a correlation coefficient (R) of 0.818 and weighted average of 1.3%, a difference of 20.5%.
Disability Age Under 5 Correlation Summary
| Measurement | Czech | Syrian |
| Minimum | 1.0% | 0.60% |
| Maximum | 28.6% | 23.9% |
| Range | 27.5% | 23.3% |
| Mean | 4.9% | 3.6% |
| Median | 2.9% | 1.7% |
| Interquartile 25% (IQ1) | 1.7% | 1.5% |
| Interquartile 75% (IQ3) | 6.6% | 3.1% |
| Interquartile Range (IQR) | 4.9% | 1.7% |
| Standard Deviation (Sample) | 5.3% | 5.8% |
| Standard Deviation (Population) | 5.2% | 5.6% |
Similar Demographics by Disability Age Under 5
Demographics Similar to Czechs by Disability Age Under 5
In terms of disability age under 5, the demographic groups most similar to Czechs are Northern European (1.6%, a difference of 0.10%), Hungarian (1.5%, a difference of 0.13%), Italian (1.6%, a difference of 0.24%), Estonian (1.5%, a difference of 0.26%), and Scandinavian (1.5%, a difference of 0.45%).
| Demographics | Rating | Rank | Disability Age Under 5 |
| Delaware | 0.0 /100 | #283 | Tragic 1.5% |
| Europeans | 0.0 /100 | #284 | Tragic 1.5% |
| Croatians | 0.0 /100 | #285 | Tragic 1.5% |
| Tlingit-Haida | 0.0 /100 | #286 | Tragic 1.5% |
| Scandinavians | 0.0 /100 | #287 | Tragic 1.5% |
| Estonians | 0.0 /100 | #288 | Tragic 1.5% |
| Hungarians | 0.0 /100 | #289 | Tragic 1.5% |
| Czechs | 0.0 /100 | #290 | Tragic 1.5% |
| Northern Europeans | 0.0 /100 | #291 | Tragic 1.6% |
| Italians | 0.0 /100 | #292 | Tragic 1.6% |
| Lithuanians | 0.0 /100 | #293 | Tragic 1.6% |
| Swedes | 0.0 /100 | #294 | Tragic 1.6% |
| Finns | 0.0 /100 | #295 | Tragic 1.6% |
| Poles | 0.0 /100 | #296 | Tragic 1.6% |
| Immigrants | Nonimmigrants | 0.0 /100 | #297 | Tragic 1.6% |
Demographics Similar to Syrians by Disability Age Under 5
In terms of disability age under 5, the demographic groups most similar to Syrians are Bangladeshi (1.3%, a difference of 0.10%), Immigrants from Chile (1.3%, a difference of 0.17%), Cypriot (1.3%, a difference of 0.20%), Immigrants from Sudan (1.3%, a difference of 0.40%), and Chilean (1.3%, a difference of 0.41%).
| Demographics | Rating | Rank | Disability Age Under 5 |
| Mexicans | 20.8 /100 | #208 | Fair 1.3% |
| Bulgarians | 19.5 /100 | #209 | Poor 1.3% |
| Pakistanis | 19.4 /100 | #210 | Poor 1.3% |
| Immigrants | Greece | 19.1 /100 | #211 | Poor 1.3% |
| Chileans | 18.8 /100 | #212 | Poor 1.3% |
| Immigrants | Sudan | 18.7 /100 | #213 | Poor 1.3% |
| Immigrants | Chile | 17.2 /100 | #214 | Poor 1.3% |
| Syrians | 16.1 /100 | #215 | Poor 1.3% |
| Bangladeshis | 15.5 /100 | #216 | Poor 1.3% |
| Cypriots | 14.9 /100 | #217 | Poor 1.3% |
| Malaysians | 13.2 /100 | #218 | Poor 1.3% |
| Immigrants | Croatia | 11.2 /100 | #219 | Poor 1.3% |
| Serbians | 9.6 /100 | #220 | Tragic 1.3% |
| Sub-Saharan Africans | 8.3 /100 | #221 | Tragic 1.3% |
| Ukrainians | 8.3 /100 | #222 | Tragic 1.3% |