Czech vs Soviet Union 2nd Grade
COMPARE
Czech
Soviet Union
2nd Grade
2nd Grade Comparison
Czechs
Soviet Union
98.5%
2ND GRADE
100.0/ 100
METRIC RATING
31st/ 347
METRIC RANK
97.9%
2ND GRADE
70.7/ 100
METRIC RATING
151st/ 347
METRIC RANK
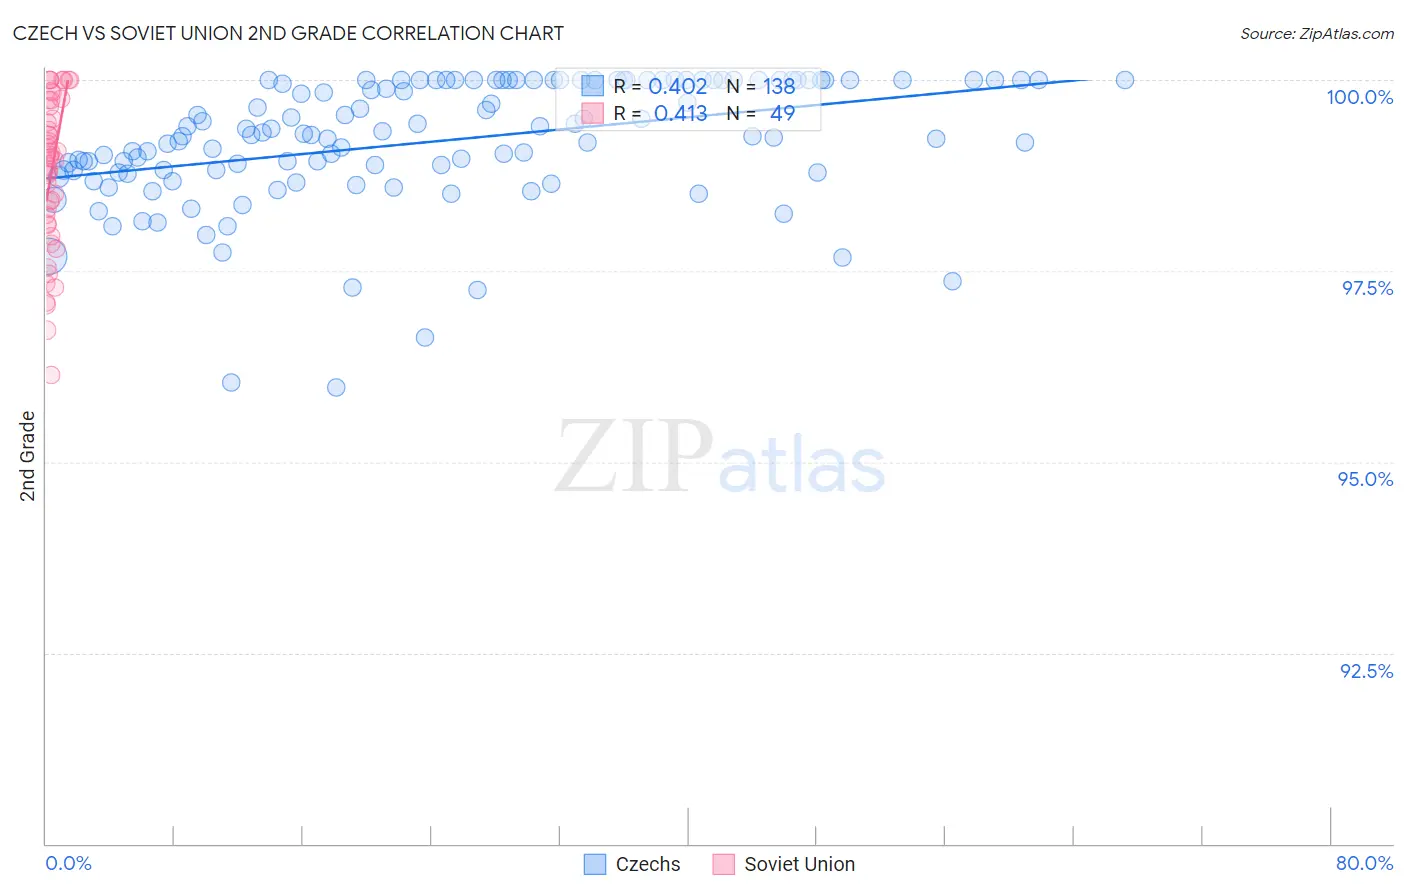
Czech vs Soviet Union 2nd Grade Correlation Chart
The statistical analysis conducted on geographies consisting of 484,813,102 people shows a moderate positive correlation between the proportion of Czechs and percentage of population with at least 2nd grade education in the United States with a correlation coefficient (R) of 0.402 and weighted average of 98.5%. Similarly, the statistical analysis conducted on geographies consisting of 43,454,395 people shows a moderate positive correlation between the proportion of Soviet Union and percentage of population with at least 2nd grade education in the United States with a correlation coefficient (R) of 0.413 and weighted average of 97.9%, a difference of 0.59%.
2nd Grade Correlation Summary
| Measurement | Czech | Soviet Union |
| Minimum | 96.0% | 96.1% |
| Maximum | 100.0% | 100.0% |
| Range | 4.0% | 3.9% |
| Mean | 99.2% | 98.8% |
| Median | 99.3% | 99.0% |
| Interquartile 25% (IQ1) | 98.8% | 98.1% |
| Interquartile 75% (IQ3) | 100.0% | 99.7% |
| Interquartile Range (IQR) | 1.2% | 1.6% |
| Standard Deviation (Sample) | 0.82% | 1.00% |
| Standard Deviation (Population) | 0.82% | 0.99% |
Similar Demographics by 2nd Grade
Demographics Similar to Czechs by 2nd Grade
In terms of 2nd grade, the demographic groups most similar to Czechs are European (98.5%, a difference of 0.0%), French Canadian (98.5%, a difference of 0.0%), Arapaho (98.5%, a difference of 0.010%), French (98.5%, a difference of 0.010%), and Scandinavian (98.5%, a difference of 0.010%).
| Demographics | Rating | Rank | 2nd Grade |
| Pennsylvania Germans | 100.0 /100 | #24 | Exceptional 98.5% |
| Scotch-Irish | 100.0 /100 | #25 | Exceptional 98.5% |
| Welsh | 100.0 /100 | #26 | Exceptional 98.5% |
| Croatians | 100.0 /100 | #27 | Exceptional 98.5% |
| Arapaho | 100.0 /100 | #28 | Exceptional 98.5% |
| French | 100.0 /100 | #29 | Exceptional 98.5% |
| Europeans | 100.0 /100 | #30 | Exceptional 98.5% |
| Czechs | 100.0 /100 | #31 | Exceptional 98.5% |
| French Canadians | 100.0 /100 | #32 | Exceptional 98.5% |
| Scandinavians | 100.0 /100 | #33 | Exceptional 98.5% |
| Chinese | 100.0 /100 | #34 | Exceptional 98.5% |
| Swiss | 100.0 /100 | #35 | Exceptional 98.5% |
| British | 100.0 /100 | #36 | Exceptional 98.5% |
| Italians | 99.9 /100 | #37 | Exceptional 98.4% |
| Latvians | 99.9 /100 | #38 | Exceptional 98.4% |
Demographics Similar to Soviet Union by 2nd Grade
In terms of 2nd grade, the demographic groups most similar to Soviet Union are Apache (97.9%, a difference of 0.010%), Immigrants from Moldova (97.9%, a difference of 0.010%), Immigrants from North Macedonia (97.9%, a difference of 0.010%), Immigrants from South Central Asia (97.9%, a difference of 0.010%), and Marshallese (97.9%, a difference of 0.010%).
| Demographics | Rating | Rank | 2nd Grade |
| Hmong | 80.0 /100 | #144 | Good 98.0% |
| Filipinos | 79.2 /100 | #145 | Good 98.0% |
| Immigrants | Israel | 78.0 /100 | #146 | Good 98.0% |
| Immigrants | Greece | 76.8 /100 | #147 | Good 98.0% |
| Jordanians | 74.5 /100 | #148 | Good 98.0% |
| Apache | 74.0 /100 | #149 | Good 97.9% |
| Immigrants | Moldova | 72.9 /100 | #150 | Good 97.9% |
| Soviet Union | 70.7 /100 | #151 | Good 97.9% |
| Immigrants | North Macedonia | 68.5 /100 | #152 | Good 97.9% |
| Immigrants | South Central Asia | 68.3 /100 | #153 | Good 97.9% |
| Marshallese | 67.7 /100 | #154 | Good 97.9% |
| French American Indians | 64.3 /100 | #155 | Good 97.9% |
| Dutch West Indians | 63.8 /100 | #156 | Good 97.9% |
| Venezuelans | 63.3 /100 | #157 | Good 97.9% |
| Immigrants | Iran | 62.8 /100 | #158 | Good 97.9% |