Immigrants vs Soviet Union Disability Age Under 5
COMPARE
Immigrants
Soviet Union
Disability Age Under 5
Disability Age Under 5 Comparison
Immigrants
Soviet Union
1.2%
DISABILITY AGE UNDER 5
88.0/ 100
METRIC RATING
129th/ 347
METRIC RANK
0.95%
DISABILITY AGE UNDER 5
100.0/ 100
METRIC RATING
13th/ 347
METRIC RANK
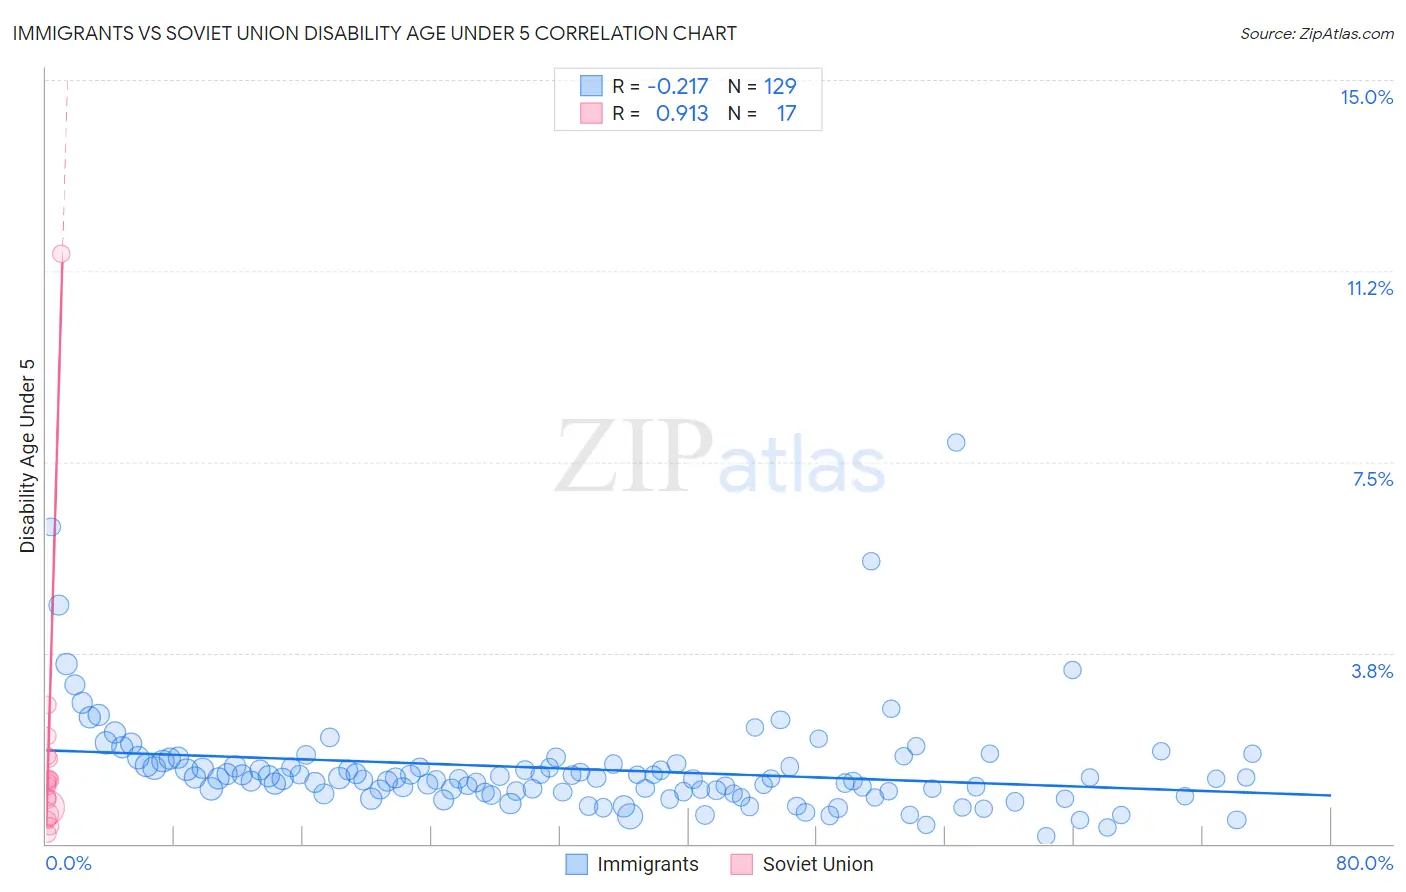
Immigrants vs Soviet Union Disability Age Under 5 Correlation Chart
The statistical analysis conducted on geographies consisting of 262,190,696 people shows a weak negative correlation between the proportion of Immigrants and percentage of population with a disability under the age of 5 in the United States with a correlation coefficient (R) of -0.217 and weighted average of 1.2%. Similarly, the statistical analysis conducted on geographies consisting of 37,806,626 people shows a near-perfect positive correlation between the proportion of Soviet Union and percentage of population with a disability under the age of 5 in the United States with a correlation coefficient (R) of 0.913 and weighted average of 0.95%, a difference of 25.2%.
Disability Age Under 5 Correlation Summary
| Measurement | Immigrants | Soviet Union |
| Minimum | 0.14% | 0.19% |
| Maximum | 7.9% | 11.6% |
| Range | 7.8% | 11.4% |
| Mean | 1.5% | 1.8% |
| Median | 1.3% | 1.2% |
| Interquartile 25% (IQ1) | 1.0% | 0.64% |
| Interquartile 75% (IQ3) | 1.5% | 1.7% |
| Interquartile Range (IQR) | 0.54% | 1.0% |
| Standard Deviation (Sample) | 1.0% | 2.6% |
| Standard Deviation (Population) | 1.0% | 2.5% |
Similar Demographics by Disability Age Under 5
Demographics Similar to Immigrants by Disability Age Under 5
In terms of disability age under 5, the demographic groups most similar to Immigrants are Korean (1.2%, a difference of 0.080%), Immigrants from Romania (1.2%, a difference of 0.090%), Immigrants from France (1.2%, a difference of 0.090%), Immigrants from Serbia (1.2%, a difference of 0.090%), and Immigrants from Eastern Europe (1.2%, a difference of 0.16%).
| Demographics | Rating | Rank | Disability Age Under 5 |
| Aleuts | 90.7 /100 | #122 | Exceptional 1.2% |
| Zimbabweans | 90.6 /100 | #123 | Exceptional 1.2% |
| Immigrants | Cambodia | 90.5 /100 | #124 | Exceptional 1.2% |
| Japanese | 90.3 /100 | #125 | Exceptional 1.2% |
| Central Americans | 89.7 /100 | #126 | Excellent 1.2% |
| Immigrants | Romania | 88.4 /100 | #127 | Excellent 1.2% |
| Immigrants | France | 88.4 /100 | #128 | Excellent 1.2% |
| Immigrants | Immigrants | 88.0 /100 | #129 | Excellent 1.2% |
| Koreans | 87.7 /100 | #130 | Excellent 1.2% |
| Immigrants | Serbia | 87.6 /100 | #131 | Excellent 1.2% |
| Immigrants | Eastern Europe | 87.3 /100 | #132 | Excellent 1.2% |
| Immigrants | Spain | 86.5 /100 | #133 | Excellent 1.2% |
| Argentineans | 85.7 /100 | #134 | Excellent 1.2% |
| Fijians | 84.7 /100 | #135 | Excellent 1.2% |
| Moroccans | 83.6 /100 | #136 | Excellent 1.2% |
Demographics Similar to Soviet Union by Disability Age Under 5
In terms of disability age under 5, the demographic groups most similar to Soviet Union are Yuman (0.95%, a difference of 0.080%), Immigrants from Hong Kong (0.95%, a difference of 0.11%), Immigrants from Grenada (0.94%, a difference of 0.17%), Afghan (0.94%, a difference of 0.19%), and Marshallese (0.94%, a difference of 0.95%).
| Demographics | Rating | Rank | Disability Age Under 5 |
| Ute | 100.0 /100 | #6 | Exceptional 0.86% |
| Immigrants | Afghanistan | 100.0 /100 | #7 | Exceptional 0.91% |
| Immigrants | Yemen | 100.0 /100 | #8 | Exceptional 0.91% |
| Immigrants | Fiji | 100.0 /100 | #9 | Exceptional 0.92% |
| Marshallese | 100.0 /100 | #10 | Exceptional 0.94% |
| Afghans | 100.0 /100 | #11 | Exceptional 0.94% |
| Immigrants | Grenada | 100.0 /100 | #12 | Exceptional 0.94% |
| Soviet Union | 100.0 /100 | #13 | Exceptional 0.95% |
| Yuman | 100.0 /100 | #14 | Exceptional 0.95% |
| Immigrants | Hong Kong | 100.0 /100 | #15 | Exceptional 0.95% |
| Immigrants | Israel | 100.0 /100 | #16 | Exceptional 0.96% |
| Immigrants | China | 100.0 /100 | #17 | Exceptional 0.96% |
| Immigrants | Barbados | 100.0 /100 | #18 | Exceptional 0.97% |
| Puget Sound Salish | 100.0 /100 | #19 | Exceptional 0.97% |
| Nepalese | 100.0 /100 | #20 | Exceptional 0.97% |