Immigrants from Ethiopia vs Soviet Union Disability Age Under 5
COMPARE
Immigrants from Ethiopia
Soviet Union
Disability Age Under 5
Disability Age Under 5 Comparison
Immigrants from Ethiopia
Soviet Union
1.1%
DISABILITY AGE UNDER 5
99.2/ 100
METRIC RATING
61st/ 347
METRIC RANK
0.95%
DISABILITY AGE UNDER 5
100.0/ 100
METRIC RATING
13th/ 347
METRIC RANK
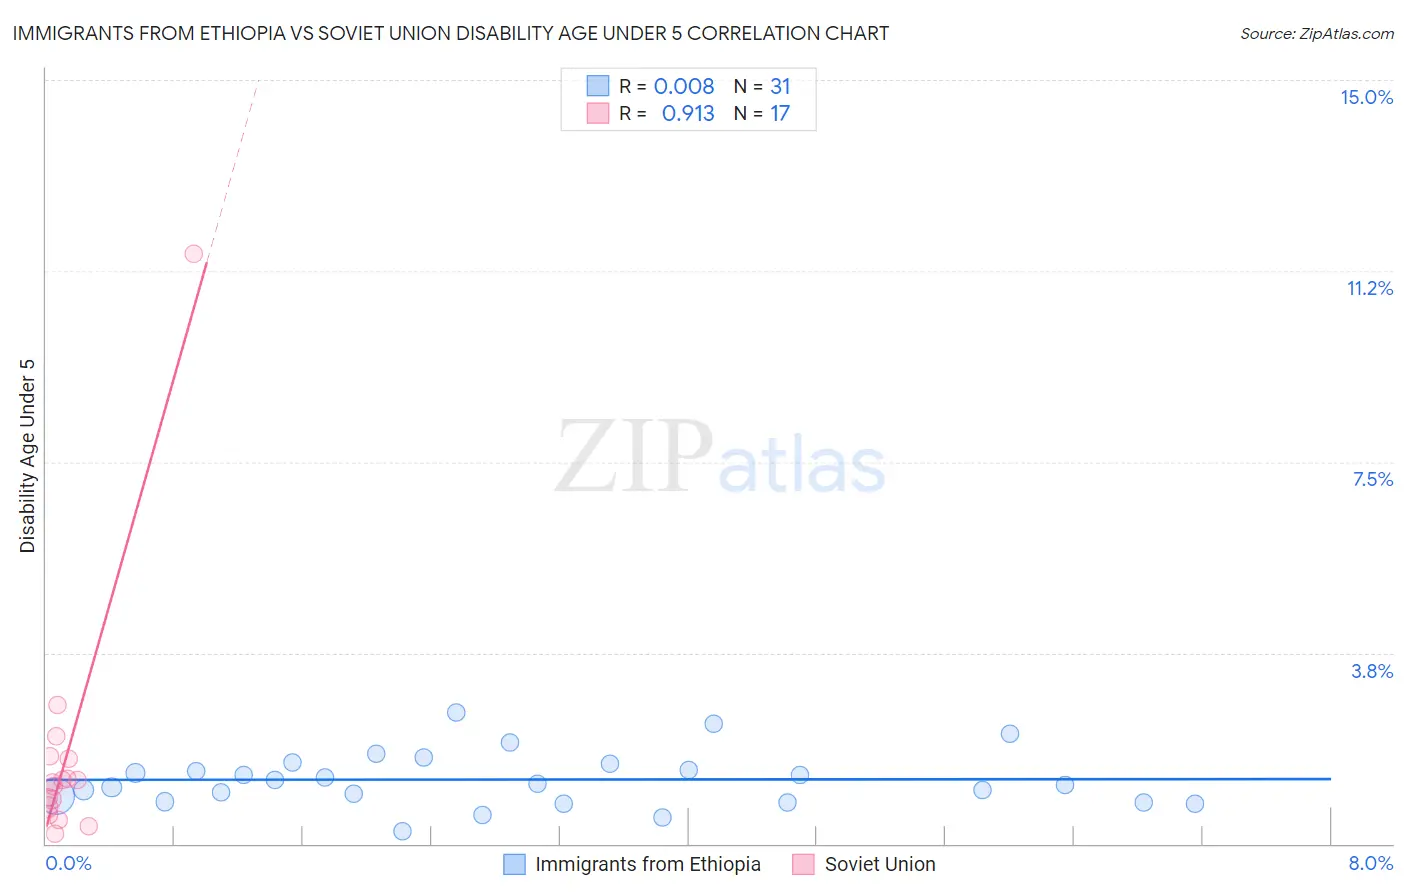
Immigrants from Ethiopia vs Soviet Union Disability Age Under 5 Correlation Chart
The statistical analysis conducted on geographies consisting of 138,545,864 people shows no correlation between the proportion of Immigrants from Ethiopia and percentage of population with a disability under the age of 5 in the United States with a correlation coefficient (R) of 0.008 and weighted average of 1.1%. Similarly, the statistical analysis conducted on geographies consisting of 37,806,626 people shows a near-perfect positive correlation between the proportion of Soviet Union and percentage of population with a disability under the age of 5 in the United States with a correlation coefficient (R) of 0.913 and weighted average of 0.95%, a difference of 17.0%.
Disability Age Under 5 Correlation Summary
| Measurement | Immigrants from Ethiopia | Soviet Union |
| Minimum | 0.25% | 0.19% |
| Maximum | 2.6% | 11.6% |
| Range | 2.3% | 11.4% |
| Mean | 1.3% | 1.8% |
| Median | 1.2% | 1.2% |
| Interquartile 25% (IQ1) | 0.83% | 0.64% |
| Interquartile 75% (IQ3) | 1.6% | 1.7% |
| Interquartile Range (IQR) | 0.74% | 1.0% |
| Standard Deviation (Sample) | 0.53% | 2.6% |
| Standard Deviation (Population) | 0.52% | 2.5% |
Similar Demographics by Disability Age Under 5
Demographics Similar to Immigrants from Ethiopia by Disability Age Under 5
In terms of disability age under 5, the demographic groups most similar to Immigrants from Ethiopia are Immigrants from Switzerland (1.1%, a difference of 0.010%), Immigrants from Western Asia (1.1%, a difference of 0.060%), Immigrants from Vietnam (1.1%, a difference of 0.12%), Egyptian (1.1%, a difference of 0.58%), and Immigrants from Malaysia (1.1%, a difference of 0.82%).
| Demographics | Rating | Rank | Disability Age Under 5 |
| Immigrants | El Salvador | 99.6 /100 | #54 | Exceptional 1.1% |
| Salvadorans | 99.5 /100 | #55 | Exceptional 1.1% |
| Ecuadorians | 99.5 /100 | #56 | Exceptional 1.1% |
| Assyrians/Chaldeans/Syriacs | 99.5 /100 | #57 | Exceptional 1.1% |
| Immigrants | Egypt | 99.4 /100 | #58 | Exceptional 1.1% |
| Immigrants | Malaysia | 99.4 /100 | #59 | Exceptional 1.1% |
| Immigrants | Western Asia | 99.2 /100 | #60 | Exceptional 1.1% |
| Immigrants | Ethiopia | 99.2 /100 | #61 | Exceptional 1.1% |
| Immigrants | Switzerland | 99.2 /100 | #62 | Exceptional 1.1% |
| Immigrants | Vietnam | 99.1 /100 | #63 | Exceptional 1.1% |
| Egyptians | 98.9 /100 | #64 | Exceptional 1.1% |
| Immigrants | Korea | 98.8 /100 | #65 | Exceptional 1.1% |
| Immigrants | Indonesia | 98.7 /100 | #66 | Exceptional 1.1% |
| Immigrants | Belize | 98.7 /100 | #67 | Exceptional 1.1% |
| South Africans | 98.7 /100 | #68 | Exceptional 1.1% |
Demographics Similar to Soviet Union by Disability Age Under 5
In terms of disability age under 5, the demographic groups most similar to Soviet Union are Yuman (0.95%, a difference of 0.080%), Immigrants from Hong Kong (0.95%, a difference of 0.11%), Immigrants from Grenada (0.94%, a difference of 0.17%), Afghan (0.94%, a difference of 0.19%), and Marshallese (0.94%, a difference of 0.95%).
| Demographics | Rating | Rank | Disability Age Under 5 |
| Ute | 100.0 /100 | #6 | Exceptional 0.86% |
| Immigrants | Afghanistan | 100.0 /100 | #7 | Exceptional 0.91% |
| Immigrants | Yemen | 100.0 /100 | #8 | Exceptional 0.91% |
| Immigrants | Fiji | 100.0 /100 | #9 | Exceptional 0.92% |
| Marshallese | 100.0 /100 | #10 | Exceptional 0.94% |
| Afghans | 100.0 /100 | #11 | Exceptional 0.94% |
| Immigrants | Grenada | 100.0 /100 | #12 | Exceptional 0.94% |
| Soviet Union | 100.0 /100 | #13 | Exceptional 0.95% |
| Yuman | 100.0 /100 | #14 | Exceptional 0.95% |
| Immigrants | Hong Kong | 100.0 /100 | #15 | Exceptional 0.95% |
| Immigrants | Israel | 100.0 /100 | #16 | Exceptional 0.96% |
| Immigrants | China | 100.0 /100 | #17 | Exceptional 0.96% |
| Immigrants | Barbados | 100.0 /100 | #18 | Exceptional 0.97% |
| Puget Sound Salish | 100.0 /100 | #19 | Exceptional 0.97% |
| Nepalese | 100.0 /100 | #20 | Exceptional 0.97% |