Delaware vs Immigrants from Sweden Disability
COMPARE
Delaware
Immigrants from Sweden
Disability
Disability Comparison
Delaware
Immigrants from Sweden
13.6%
DISABILITY
0.0/ 100
METRIC RATING
311th/ 347
METRIC RANK
11.0%
DISABILITY
99.6/ 100
METRIC RATING
64th/ 347
METRIC RANK
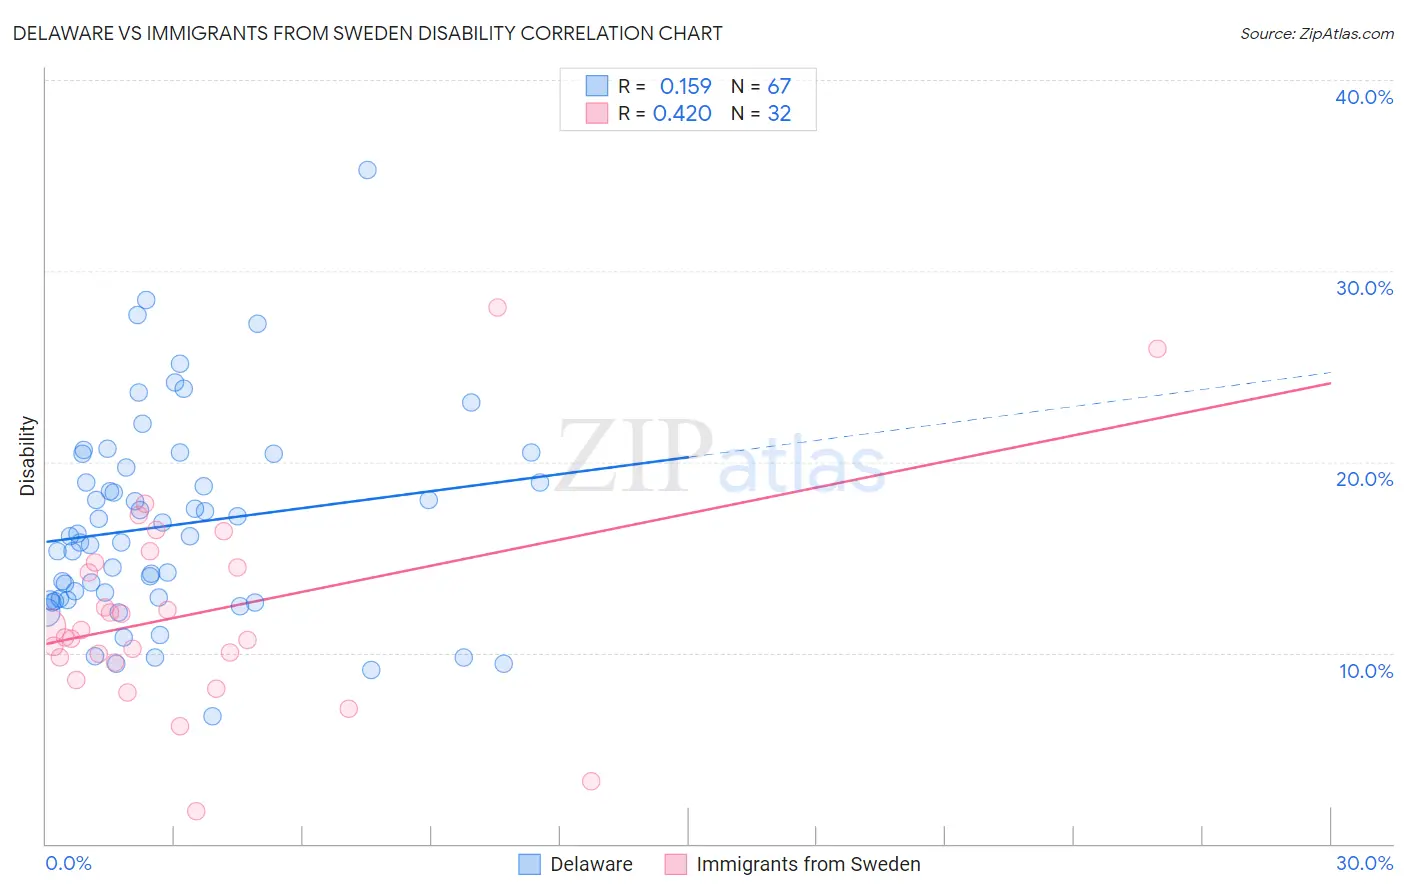
Delaware vs Immigrants from Sweden Disability Correlation Chart
The statistical analysis conducted on geographies consisting of 96,240,981 people shows a poor positive correlation between the proportion of Delaware and percentage of population with a disability in the United States with a correlation coefficient (R) of 0.159 and weighted average of 13.6%. Similarly, the statistical analysis conducted on geographies consisting of 164,749,028 people shows a moderate positive correlation between the proportion of Immigrants from Sweden and percentage of population with a disability in the United States with a correlation coefficient (R) of 0.420 and weighted average of 11.0%, a difference of 24.1%.
Disability Correlation Summary
| Measurement | Delaware | Immigrants from Sweden |
| Minimum | 6.7% | 1.7% |
| Maximum | 35.3% | 28.1% |
| Range | 28.6% | 26.4% |
| Mean | 16.7% | 12.1% |
| Median | 16.1% | 11.0% |
| Interquartile 25% (IQ1) | 12.8% | 9.6% |
| Interquartile 75% (IQ3) | 19.7% | 14.6% |
| Interquartile Range (IQR) | 6.9% | 4.9% |
| Standard Deviation (Sample) | 5.3% | 5.4% |
| Standard Deviation (Population) | 5.3% | 5.3% |
Similar Demographics by Disability
Demographics Similar to Delaware by Disability
In terms of disability, the demographic groups most similar to Delaware are Blackfeet (13.6%, a difference of 0.040%), Spanish American (13.6%, a difference of 0.24%), Tlingit-Haida (13.5%, a difference of 0.56%), Cree (13.7%, a difference of 0.59%), and Black/African American (13.7%, a difference of 0.63%).
| Demographics | Rating | Rank | Disability |
| Yakama | 0.0 /100 | #304 | Tragic 13.4% |
| French Canadians | 0.0 /100 | #305 | Tragic 13.4% |
| Cape Verdeans | 0.0 /100 | #306 | Tragic 13.5% |
| Shoshone | 0.0 /100 | #307 | Tragic 13.5% |
| French American Indians | 0.0 /100 | #308 | Tragic 13.5% |
| Tlingit-Haida | 0.0 /100 | #309 | Tragic 13.5% |
| Blackfeet | 0.0 /100 | #310 | Tragic 13.6% |
| Delaware | 0.0 /100 | #311 | Tragic 13.6% |
| Spanish Americans | 0.0 /100 | #312 | Tragic 13.6% |
| Cree | 0.0 /100 | #313 | Tragic 13.7% |
| Blacks/African Americans | 0.0 /100 | #314 | Tragic 13.7% |
| Puget Sound Salish | 0.0 /100 | #315 | Tragic 13.7% |
| Pima | 0.0 /100 | #316 | Tragic 13.7% |
| Immigrants | Cabo Verde | 0.0 /100 | #317 | Tragic 13.7% |
| Menominee | 0.0 /100 | #318 | Tragic 13.8% |
Demographics Similar to Immigrants from Sweden by Disability
In terms of disability, the demographic groups most similar to Immigrants from Sweden are Bulgarian (11.0%, a difference of 0.020%), Laotian (11.0%, a difference of 0.030%), Colombian (11.0%, a difference of 0.11%), Immigrants from Eritrea (11.0%, a difference of 0.18%), and Immigrants from Northern Africa (10.9%, a difference of 0.20%).
| Demographics | Rating | Rank | Disability |
| Salvadorans | 99.8 /100 | #57 | Exceptional 10.9% |
| Immigrants | South America | 99.8 /100 | #58 | Exceptional 10.9% |
| Immigrants | Colombia | 99.7 /100 | #59 | Exceptional 10.9% |
| Zimbabweans | 99.7 /100 | #60 | Exceptional 10.9% |
| Immigrants | Bulgaria | 99.7 /100 | #61 | Exceptional 10.9% |
| Immigrants | Northern Africa | 99.7 /100 | #62 | Exceptional 10.9% |
| Immigrants | Eritrea | 99.7 /100 | #63 | Exceptional 11.0% |
| Immigrants | Sweden | 99.6 /100 | #64 | Exceptional 11.0% |
| Bulgarians | 99.6 /100 | #65 | Exceptional 11.0% |
| Laotians | 99.6 /100 | #66 | Exceptional 11.0% |
| Colombians | 99.6 /100 | #67 | Exceptional 11.0% |
| Immigrants | Afghanistan | 99.6 /100 | #68 | Exceptional 11.0% |
| Sri Lankans | 99.5 /100 | #69 | Exceptional 11.0% |
| Immigrants | France | 99.4 /100 | #70 | Exceptional 11.0% |
| Immigrants | Lebanon | 99.4 /100 | #71 | Exceptional 11.0% |