Immigrants from Jamaica vs Immigrants from Sweden Disability
COMPARE
Immigrants from Jamaica
Immigrants from Sweden
Disability
Disability Comparison
Immigrants from Jamaica
Immigrants from Sweden
12.1%
DISABILITY
5.0/ 100
METRIC RATING
218th/ 347
METRIC RANK
11.0%
DISABILITY
99.6/ 100
METRIC RATING
64th/ 347
METRIC RANK
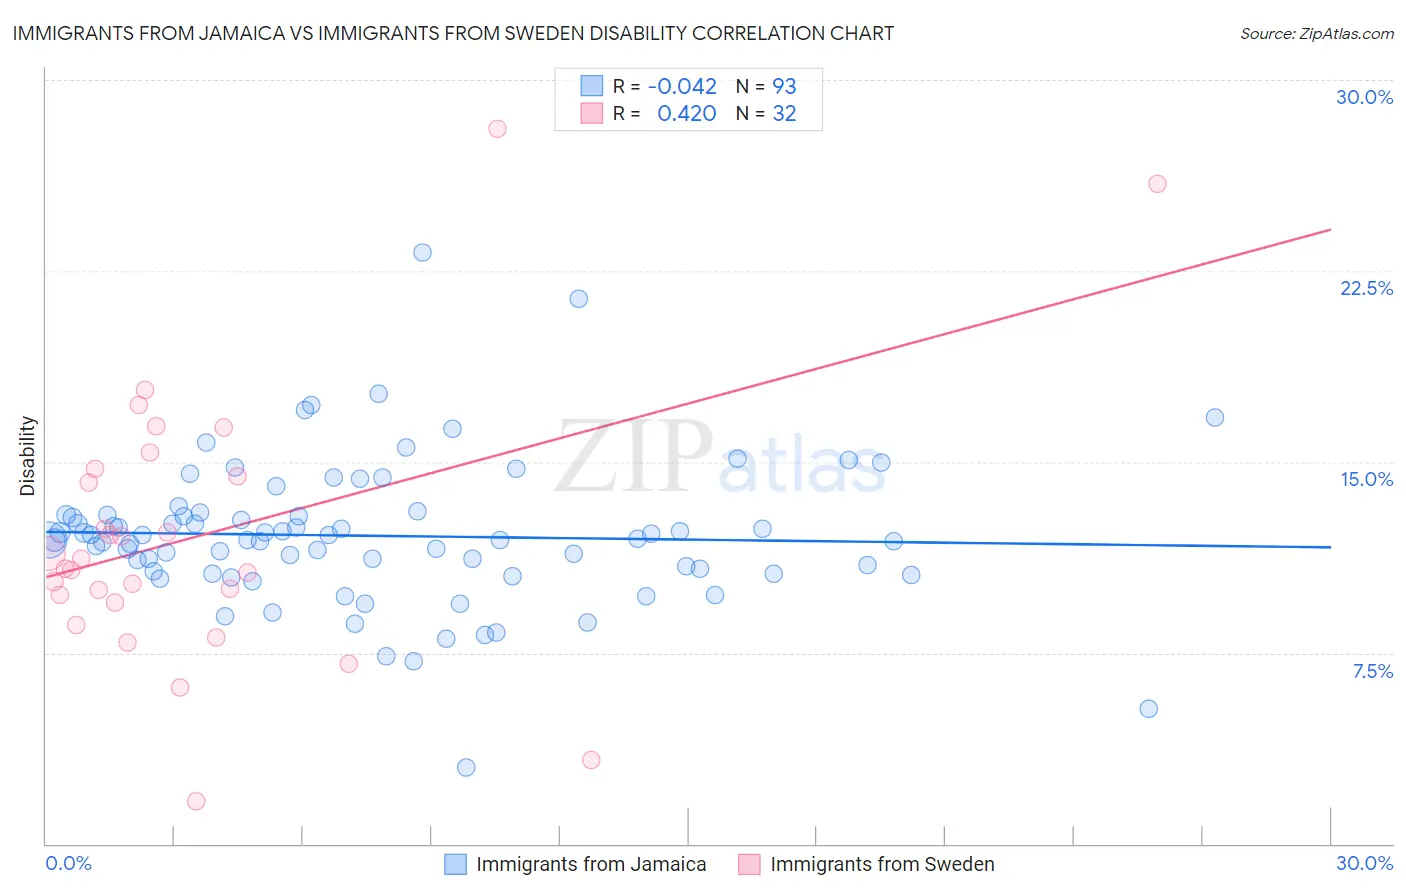
Immigrants from Jamaica vs Immigrants from Sweden Disability Correlation Chart
The statistical analysis conducted on geographies consisting of 301,749,565 people shows no correlation between the proportion of Immigrants from Jamaica and percentage of population with a disability in the United States with a correlation coefficient (R) of -0.042 and weighted average of 12.1%. Similarly, the statistical analysis conducted on geographies consisting of 164,749,028 people shows a moderate positive correlation between the proportion of Immigrants from Sweden and percentage of population with a disability in the United States with a correlation coefficient (R) of 0.420 and weighted average of 11.0%, a difference of 10.1%.
Disability Correlation Summary
| Measurement | Immigrants from Jamaica | Immigrants from Sweden |
| Minimum | 3.0% | 1.7% |
| Maximum | 23.2% | 28.1% |
| Range | 20.2% | 26.4% |
| Mean | 12.1% | 12.1% |
| Median | 12.0% | 11.0% |
| Interquartile 25% (IQ1) | 10.7% | 9.6% |
| Interquartile 75% (IQ3) | 12.9% | 14.6% |
| Interquartile Range (IQR) | 2.3% | 4.9% |
| Standard Deviation (Sample) | 2.9% | 5.4% |
| Standard Deviation (Population) | 2.9% | 5.3% |
Similar Demographics by Disability
Demographics Similar to Immigrants from Jamaica by Disability
In terms of disability, the demographic groups most similar to Immigrants from Jamaica are Croatian (12.1%, a difference of 0.040%), Immigrants from North America (12.1%, a difference of 0.060%), Panamanian (12.1%, a difference of 0.070%), Immigrants from Bahamas (12.1%, a difference of 0.080%), and Northern European (12.1%, a difference of 0.20%).
| Demographics | Rating | Rank | Disability |
| Immigrants | Cambodia | 7.3 /100 | #211 | Tragic 12.0% |
| Austrians | 7.2 /100 | #212 | Tragic 12.0% |
| Immigrants | Iraq | 7.1 /100 | #213 | Tragic 12.0% |
| Immigrants | Somalia | 6.8 /100 | #214 | Tragic 12.0% |
| Immigrants | Canada | 6.1 /100 | #215 | Tragic 12.1% |
| Panamanians | 5.4 /100 | #216 | Tragic 12.1% |
| Immigrants | North America | 5.3 /100 | #217 | Tragic 12.1% |
| Immigrants | Jamaica | 5.0 /100 | #218 | Tragic 12.1% |
| Croatians | 4.9 /100 | #219 | Tragic 12.1% |
| Immigrants | Bahamas | 4.7 /100 | #220 | Tragic 12.1% |
| Northern Europeans | 4.2 /100 | #221 | Tragic 12.1% |
| Spanish American Indians | 4.1 /100 | #222 | Tragic 12.1% |
| Hispanics or Latinos | 3.9 /100 | #223 | Tragic 12.1% |
| Mexicans | 3.7 /100 | #224 | Tragic 12.1% |
| Senegalese | 3.5 /100 | #225 | Tragic 12.1% |
Demographics Similar to Immigrants from Sweden by Disability
In terms of disability, the demographic groups most similar to Immigrants from Sweden are Bulgarian (11.0%, a difference of 0.020%), Laotian (11.0%, a difference of 0.030%), Colombian (11.0%, a difference of 0.11%), Immigrants from Eritrea (11.0%, a difference of 0.18%), and Immigrants from Northern Africa (10.9%, a difference of 0.20%).
| Demographics | Rating | Rank | Disability |
| Salvadorans | 99.8 /100 | #57 | Exceptional 10.9% |
| Immigrants | South America | 99.8 /100 | #58 | Exceptional 10.9% |
| Immigrants | Colombia | 99.7 /100 | #59 | Exceptional 10.9% |
| Zimbabweans | 99.7 /100 | #60 | Exceptional 10.9% |
| Immigrants | Bulgaria | 99.7 /100 | #61 | Exceptional 10.9% |
| Immigrants | Northern Africa | 99.7 /100 | #62 | Exceptional 10.9% |
| Immigrants | Eritrea | 99.7 /100 | #63 | Exceptional 11.0% |
| Immigrants | Sweden | 99.6 /100 | #64 | Exceptional 11.0% |
| Bulgarians | 99.6 /100 | #65 | Exceptional 11.0% |
| Laotians | 99.6 /100 | #66 | Exceptional 11.0% |
| Colombians | 99.6 /100 | #67 | Exceptional 11.0% |
| Immigrants | Afghanistan | 99.6 /100 | #68 | Exceptional 11.0% |
| Sri Lankans | 99.5 /100 | #69 | Exceptional 11.0% |
| Immigrants | France | 99.4 /100 | #70 | Exceptional 11.0% |
| Immigrants | Lebanon | 99.4 /100 | #71 | Exceptional 11.0% |