Celtic vs Immigrants from Sweden Median Female Earnings
COMPARE
Celtic
Immigrants from Sweden
Median Female Earnings
Median Female Earnings Comparison
Celtics
Immigrants from Sweden
$38,283
MEDIAN FEMALE EARNINGS
5.0/ 100
METRIC RATING
234th/ 347
METRIC RANK
$44,774
MEDIAN FEMALE EARNINGS
100.0/ 100
METRIC RATING
25th/ 347
METRIC RANK
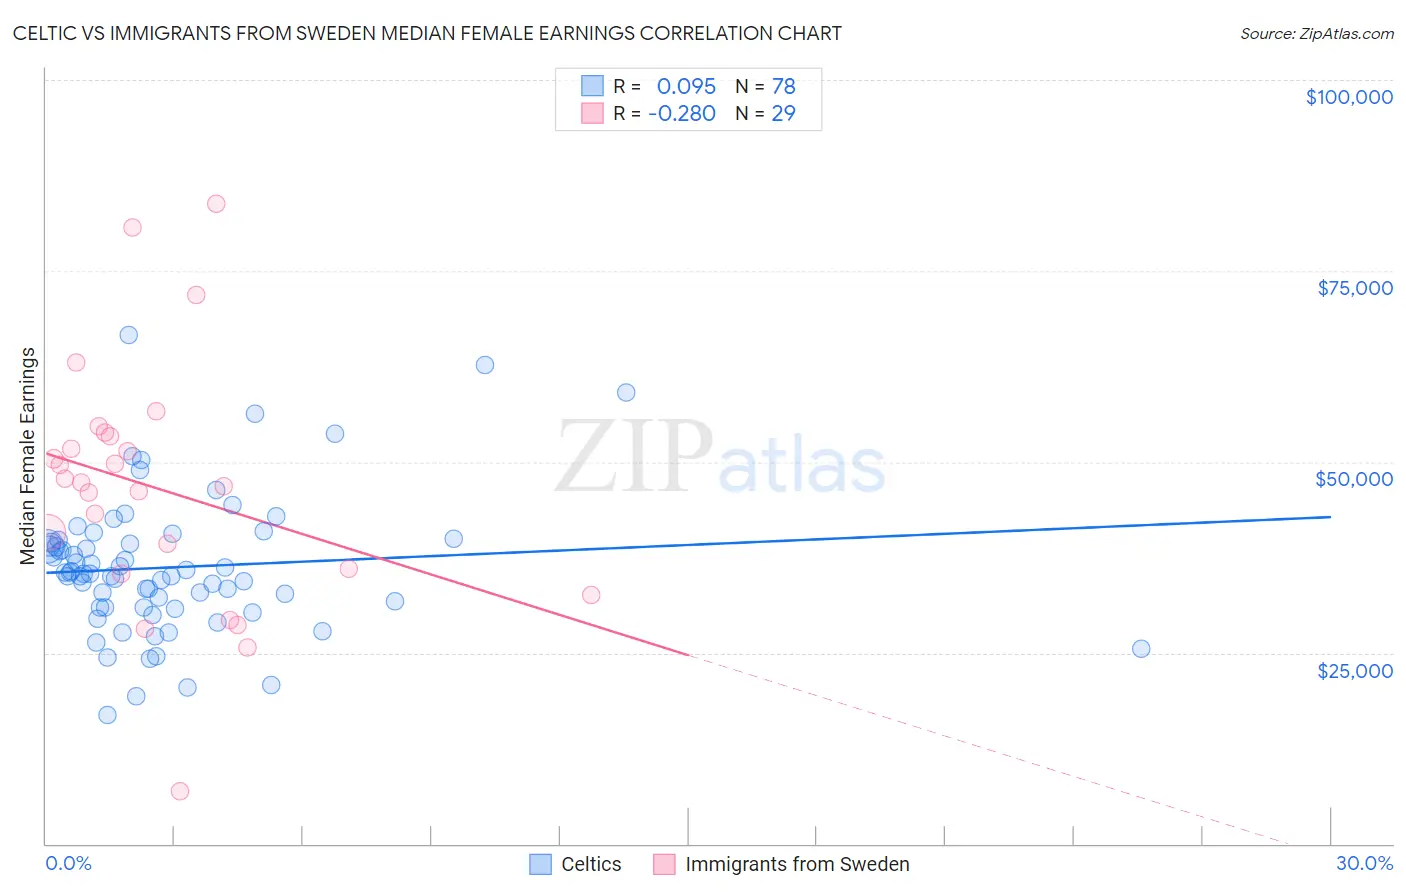
Celtic vs Immigrants from Sweden Median Female Earnings Correlation Chart
The statistical analysis conducted on geographies consisting of 168,839,546 people shows a slight positive correlation between the proportion of Celtics and median female earnings in the United States with a correlation coefficient (R) of 0.095 and weighted average of $38,283. Similarly, the statistical analysis conducted on geographies consisting of 164,714,291 people shows a weak negative correlation between the proportion of Immigrants from Sweden and median female earnings in the United States with a correlation coefficient (R) of -0.280 and weighted average of $44,774, a difference of 17.0%.
Median Female Earnings Correlation Summary
| Measurement | Celtic | Immigrants from Sweden |
| Minimum | $16,819 | $6,800 |
| Maximum | $66,675 | $83,727 |
| Range | $49,856 | $76,927 |
| Mean | $36,202 | $46,568 |
| Median | $35,368 | $47,333 |
| Interquartile 25% (IQ1) | $30,981 | $35,642 |
| Interquartile 75% (IQ3) | $39,367 | $53,626 |
| Interquartile Range (IQR) | $8,386 | $17,985 |
| Standard Deviation (Sample) | $9,110 | $16,157 |
| Standard Deviation (Population) | $9,052 | $15,876 |
Similar Demographics by Median Female Earnings
Demographics Similar to Celtics by Median Female Earnings
In terms of median female earnings, the demographic groups most similar to Celtics are Tongan ($38,288, a difference of 0.010%), Scandinavian ($38,306, a difference of 0.060%), Somali ($38,333, a difference of 0.13%), Basque ($38,352, a difference of 0.18%), and Sudanese ($38,215, a difference of 0.18%).
| Demographics | Rating | Rank | Median Female Earnings |
| Scottish | 6.3 /100 | #227 | Tragic $38,397 |
| Sub-Saharan Africans | 6.2 /100 | #228 | Tragic $38,391 |
| Belgians | 6.1 /100 | #229 | Tragic $38,382 |
| Basques | 5.7 /100 | #230 | Tragic $38,352 |
| Somalis | 5.5 /100 | #231 | Tragic $38,333 |
| Scandinavians | 5.2 /100 | #232 | Tragic $38,306 |
| Tongans | 5.1 /100 | #233 | Tragic $38,288 |
| Celtics | 5.0 /100 | #234 | Tragic $38,283 |
| Sudanese | 4.4 /100 | #235 | Tragic $38,215 |
| Liberians | 4.4 /100 | #236 | Tragic $38,215 |
| Immigrants | Cabo Verde | 4.3 /100 | #237 | Tragic $38,208 |
| Alaska Natives | 4.3 /100 | #238 | Tragic $38,202 |
| English | 4.2 /100 | #239 | Tragic $38,196 |
| Finns | 4.0 /100 | #240 | Tragic $38,173 |
| Spanish | 3.5 /100 | #241 | Tragic $38,098 |
Demographics Similar to Immigrants from Sweden by Median Female Earnings
In terms of median female earnings, the demographic groups most similar to Immigrants from Sweden are Immigrants from Belarus ($44,757, a difference of 0.040%), Immigrants from Korea ($44,847, a difference of 0.16%), Turkish ($44,695, a difference of 0.18%), Immigrants from Russia ($44,680, a difference of 0.21%), and Burmese ($44,911, a difference of 0.31%).
| Demographics | Rating | Rank | Median Female Earnings |
| Cypriots | 100.0 /100 | #18 | Exceptional $45,570 |
| Eastern Europeans | 100.0 /100 | #19 | Exceptional $45,385 |
| Immigrants | Japan | 100.0 /100 | #20 | Exceptional $45,323 |
| Cambodians | 100.0 /100 | #21 | Exceptional $45,014 |
| Immigrants | Greece | 100.0 /100 | #22 | Exceptional $44,976 |
| Burmese | 100.0 /100 | #23 | Exceptional $44,911 |
| Immigrants | Korea | 100.0 /100 | #24 | Exceptional $44,847 |
| Immigrants | Sweden | 100.0 /100 | #25 | Exceptional $44,774 |
| Immigrants | Belarus | 100.0 /100 | #26 | Exceptional $44,757 |
| Turks | 100.0 /100 | #27 | Exceptional $44,695 |
| Immigrants | Russia | 100.0 /100 | #28 | Exceptional $44,680 |
| Immigrants | Belgium | 100.0 /100 | #29 | Exceptional $44,587 |
| Asians | 100.0 /100 | #30 | Exceptional $44,586 |
| Immigrants | France | 100.0 /100 | #31 | Exceptional $44,541 |
| Immigrants | Northern Europe | 100.0 /100 | #32 | Exceptional $44,366 |