Immigrants from Cambodia vs Immigrants from Sweden Disability
COMPARE
Immigrants from Cambodia
Immigrants from Sweden
Disability
Disability Comparison
Immigrants from Cambodia
Immigrants from Sweden
12.0%
DISABILITY
7.3/ 100
METRIC RATING
211th/ 347
METRIC RANK
11.0%
DISABILITY
99.6/ 100
METRIC RATING
64th/ 347
METRIC RANK
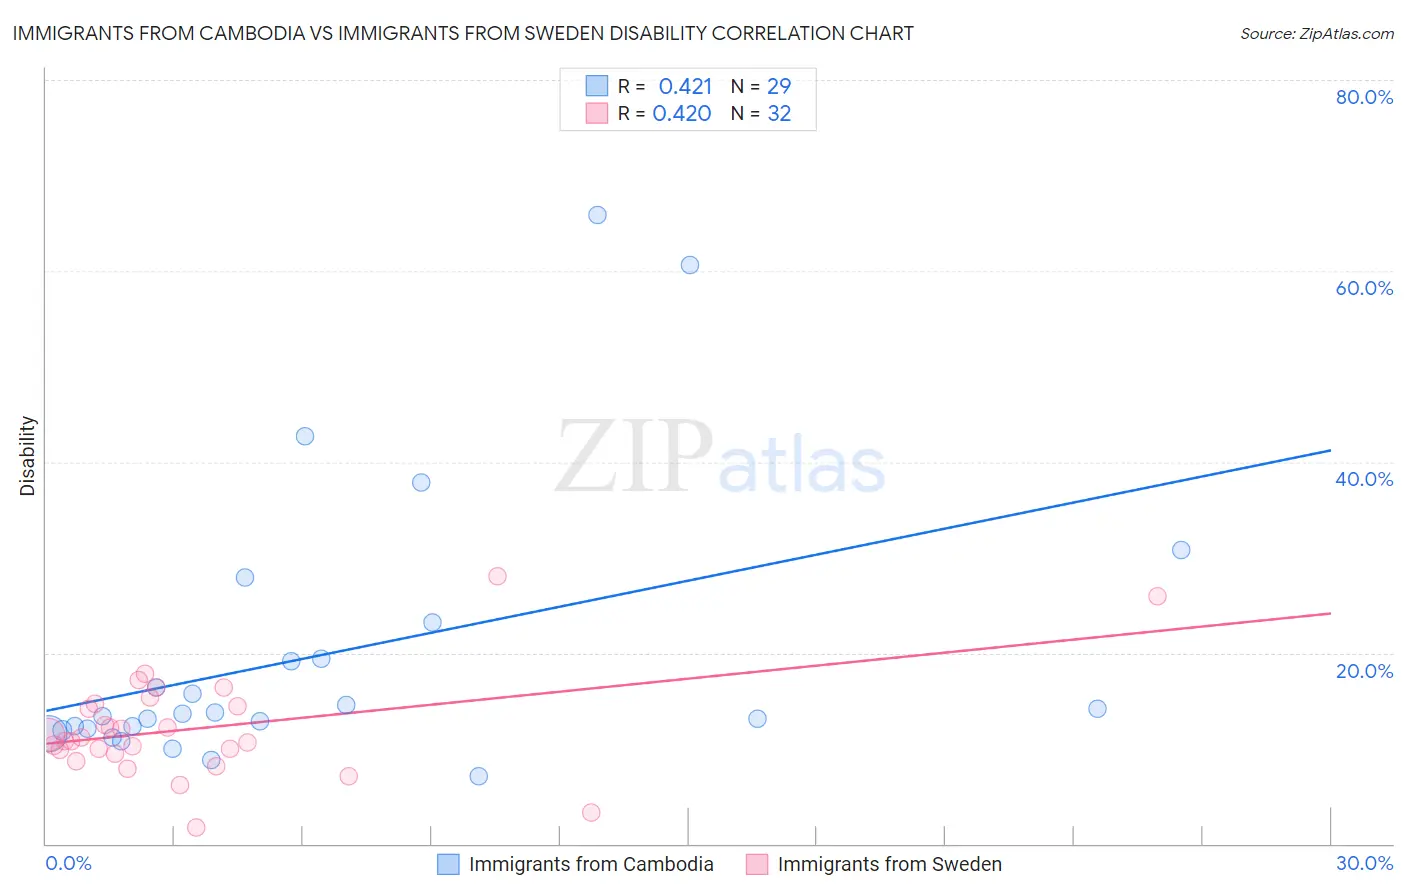
Immigrants from Cambodia vs Immigrants from Sweden Disability Correlation Chart
The statistical analysis conducted on geographies consisting of 205,156,443 people shows a moderate positive correlation between the proportion of Immigrants from Cambodia and percentage of population with a disability in the United States with a correlation coefficient (R) of 0.421 and weighted average of 12.0%. Similarly, the statistical analysis conducted on geographies consisting of 164,749,028 people shows a moderate positive correlation between the proportion of Immigrants from Sweden and percentage of population with a disability in the United States with a correlation coefficient (R) of 0.420 and weighted average of 11.0%, a difference of 9.6%.
Disability Correlation Summary
| Measurement | Immigrants from Cambodia | Immigrants from Sweden |
| Minimum | 7.1% | 1.7% |
| Maximum | 65.9% | 28.1% |
| Range | 58.9% | 26.4% |
| Mean | 19.9% | 12.1% |
| Median | 13.6% | 11.0% |
| Interquartile 25% (IQ1) | 12.0% | 9.6% |
| Interquartile 75% (IQ3) | 21.2% | 14.6% |
| Interquartile Range (IQR) | 9.2% | 4.9% |
| Standard Deviation (Sample) | 14.7% | 5.4% |
| Standard Deviation (Population) | 14.4% | 5.3% |
Similar Demographics by Disability
Demographics Similar to Immigrants from Cambodia by Disability
In terms of disability, the demographic groups most similar to Immigrants from Cambodia are Austrian (12.0%, a difference of 0.030%), Immigrants from Iraq (12.0%, a difference of 0.030%), Czech (12.0%, a difference of 0.080%), Immigrants from Somalia (12.0%, a difference of 0.080%), and Danish (12.0%, a difference of 0.20%).
| Demographics | Rating | Rank | Disability |
| Mexican American Indians | 11.4 /100 | #204 | Poor 12.0% |
| Immigrants | Western Europe | 10.1 /100 | #205 | Poor 12.0% |
| Immigrants | Senegal | 9.4 /100 | #206 | Tragic 12.0% |
| Immigrants | Thailand | 9.3 /100 | #207 | Tragic 12.0% |
| Immigrants | Caribbean | 9.1 /100 | #208 | Tragic 12.0% |
| Danes | 8.7 /100 | #209 | Tragic 12.0% |
| Czechs | 7.9 /100 | #210 | Tragic 12.0% |
| Immigrants | Cambodia | 7.3 /100 | #211 | Tragic 12.0% |
| Austrians | 7.2 /100 | #212 | Tragic 12.0% |
| Immigrants | Iraq | 7.1 /100 | #213 | Tragic 12.0% |
| Immigrants | Somalia | 6.8 /100 | #214 | Tragic 12.0% |
| Immigrants | Canada | 6.1 /100 | #215 | Tragic 12.1% |
| Panamanians | 5.4 /100 | #216 | Tragic 12.1% |
| Immigrants | North America | 5.3 /100 | #217 | Tragic 12.1% |
| Immigrants | Jamaica | 5.0 /100 | #218 | Tragic 12.1% |
Demographics Similar to Immigrants from Sweden by Disability
In terms of disability, the demographic groups most similar to Immigrants from Sweden are Bulgarian (11.0%, a difference of 0.020%), Laotian (11.0%, a difference of 0.030%), Colombian (11.0%, a difference of 0.11%), Immigrants from Eritrea (11.0%, a difference of 0.18%), and Immigrants from Northern Africa (10.9%, a difference of 0.20%).
| Demographics | Rating | Rank | Disability |
| Salvadorans | 99.8 /100 | #57 | Exceptional 10.9% |
| Immigrants | South America | 99.8 /100 | #58 | Exceptional 10.9% |
| Immigrants | Colombia | 99.7 /100 | #59 | Exceptional 10.9% |
| Zimbabweans | 99.7 /100 | #60 | Exceptional 10.9% |
| Immigrants | Bulgaria | 99.7 /100 | #61 | Exceptional 10.9% |
| Immigrants | Northern Africa | 99.7 /100 | #62 | Exceptional 10.9% |
| Immigrants | Eritrea | 99.7 /100 | #63 | Exceptional 11.0% |
| Immigrants | Sweden | 99.6 /100 | #64 | Exceptional 11.0% |
| Bulgarians | 99.6 /100 | #65 | Exceptional 11.0% |
| Laotians | 99.6 /100 | #66 | Exceptional 11.0% |
| Colombians | 99.6 /100 | #67 | Exceptional 11.0% |
| Immigrants | Afghanistan | 99.6 /100 | #68 | Exceptional 11.0% |
| Sri Lankans | 99.5 /100 | #69 | Exceptional 11.0% |
| Immigrants | France | 99.4 /100 | #70 | Exceptional 11.0% |
| Immigrants | Lebanon | 99.4 /100 | #71 | Exceptional 11.0% |