Immigrants from Northern Europe vs Immigrants from Sweden Disability
COMPARE
Immigrants from Northern Europe
Immigrants from Sweden
Disability
Disability Comparison
Immigrants from Northern Europe
Immigrants from Sweden
11.3%
DISABILITY
94.1/ 100
METRIC RATING
116th/ 347
METRIC RANK
11.0%
DISABILITY
99.6/ 100
METRIC RATING
64th/ 347
METRIC RANK
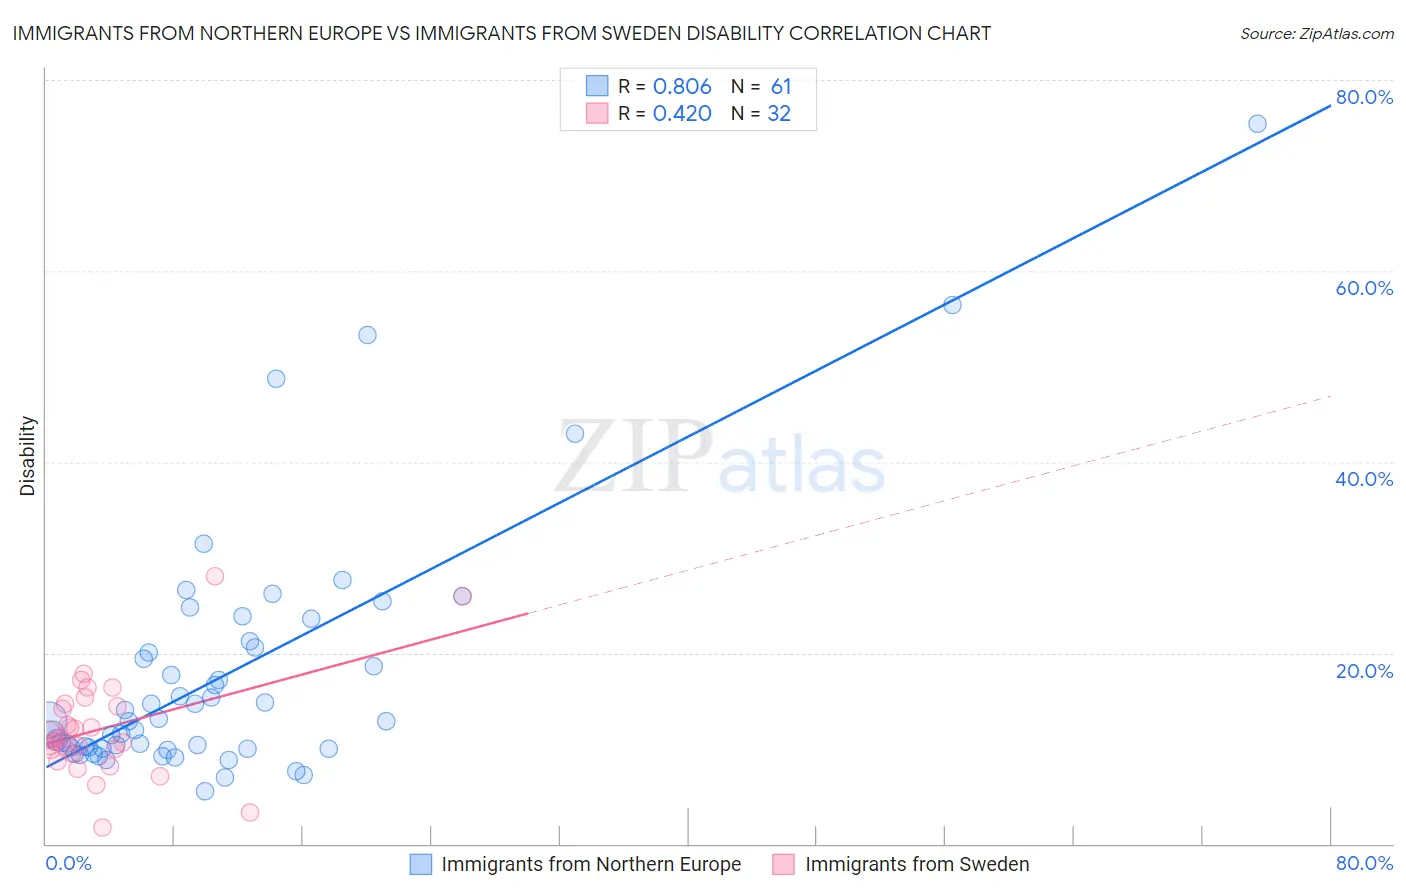
Immigrants from Northern Europe vs Immigrants from Sweden Disability Correlation Chart
The statistical analysis conducted on geographies consisting of 477,212,072 people shows a very strong positive correlation between the proportion of Immigrants from Northern Europe and percentage of population with a disability in the United States with a correlation coefficient (R) of 0.806 and weighted average of 11.3%. Similarly, the statistical analysis conducted on geographies consisting of 164,749,028 people shows a moderate positive correlation between the proportion of Immigrants from Sweden and percentage of population with a disability in the United States with a correlation coefficient (R) of 0.420 and weighted average of 11.0%, a difference of 3.4%.
Disability Correlation Summary
| Measurement | Immigrants from Northern Europe | Immigrants from Sweden |
| Minimum | 5.5% | 1.7% |
| Maximum | 75.4% | 28.1% |
| Range | 69.9% | 26.4% |
| Mean | 17.8% | 12.1% |
| Median | 12.9% | 11.0% |
| Interquartile 25% (IQ1) | 10.0% | 9.6% |
| Interquartile 75% (IQ3) | 20.9% | 14.6% |
| Interquartile Range (IQR) | 10.9% | 4.9% |
| Standard Deviation (Sample) | 13.2% | 5.4% |
| Standard Deviation (Population) | 13.1% | 5.3% |
Similar Demographics by Disability
Demographics Similar to Immigrants from Northern Europe by Disability
In terms of disability, the demographic groups most similar to Immigrants from Northern Europe are Luxembourger (11.3%, a difference of 0.060%), Korean (11.3%, a difference of 0.070%), Immigrants from Philippines (11.3%, a difference of 0.11%), Central American (11.4%, a difference of 0.12%), and Immigrants from North Macedonia (11.4%, a difference of 0.12%).
| Demographics | Rating | Rank | Disability |
| Immigrants | Uganda | 95.7 /100 | #109 | Exceptional 11.3% |
| Immigrants | Denmark | 95.6 /100 | #110 | Exceptional 11.3% |
| Immigrants | South Eastern Asia | 95.4 /100 | #111 | Exceptional 11.3% |
| Immigrants | Uzbekistan | 94.9 /100 | #112 | Exceptional 11.3% |
| Guyanese | 94.7 /100 | #113 | Exceptional 11.3% |
| Immigrants | Syria | 94.7 /100 | #114 | Exceptional 11.3% |
| Immigrants | Philippines | 94.6 /100 | #115 | Exceptional 11.3% |
| Immigrants | Northern Europe | 94.1 /100 | #116 | Exceptional 11.3% |
| Luxembourgers | 93.9 /100 | #117 | Exceptional 11.3% |
| Koreans | 93.8 /100 | #118 | Exceptional 11.3% |
| Central Americans | 93.5 /100 | #119 | Exceptional 11.4% |
| Immigrants | North Macedonia | 93.5 /100 | #120 | Exceptional 11.4% |
| Immigrants | Costa Rica | 93.4 /100 | #121 | Exceptional 11.4% |
| Brazilians | 93.3 /100 | #122 | Exceptional 11.4% |
| South Africans | 92.3 /100 | #123 | Exceptional 11.4% |
Demographics Similar to Immigrants from Sweden by Disability
In terms of disability, the demographic groups most similar to Immigrants from Sweden are Bulgarian (11.0%, a difference of 0.020%), Laotian (11.0%, a difference of 0.030%), Colombian (11.0%, a difference of 0.11%), Immigrants from Eritrea (11.0%, a difference of 0.18%), and Immigrants from Northern Africa (10.9%, a difference of 0.20%).
| Demographics | Rating | Rank | Disability |
| Salvadorans | 99.8 /100 | #57 | Exceptional 10.9% |
| Immigrants | South America | 99.8 /100 | #58 | Exceptional 10.9% |
| Immigrants | Colombia | 99.7 /100 | #59 | Exceptional 10.9% |
| Zimbabweans | 99.7 /100 | #60 | Exceptional 10.9% |
| Immigrants | Bulgaria | 99.7 /100 | #61 | Exceptional 10.9% |
| Immigrants | Northern Africa | 99.7 /100 | #62 | Exceptional 10.9% |
| Immigrants | Eritrea | 99.7 /100 | #63 | Exceptional 11.0% |
| Immigrants | Sweden | 99.6 /100 | #64 | Exceptional 11.0% |
| Bulgarians | 99.6 /100 | #65 | Exceptional 11.0% |
| Laotians | 99.6 /100 | #66 | Exceptional 11.0% |
| Colombians | 99.6 /100 | #67 | Exceptional 11.0% |
| Immigrants | Afghanistan | 99.6 /100 | #68 | Exceptional 11.0% |
| Sri Lankans | 99.5 /100 | #69 | Exceptional 11.0% |
| Immigrants | France | 99.4 /100 | #70 | Exceptional 11.0% |
| Immigrants | Lebanon | 99.4 /100 | #71 | Exceptional 11.0% |