Estonian vs Hopi Disability
COMPARE
Estonian
Hopi
Disability
Disability Comparison
Estonians
Hopi
11.7%
DISABILITY
54.4/ 100
METRIC RATING
167th/ 347
METRIC RANK
13.2%
DISABILITY
0.0/ 100
METRIC RATING
297th/ 347
METRIC RANK
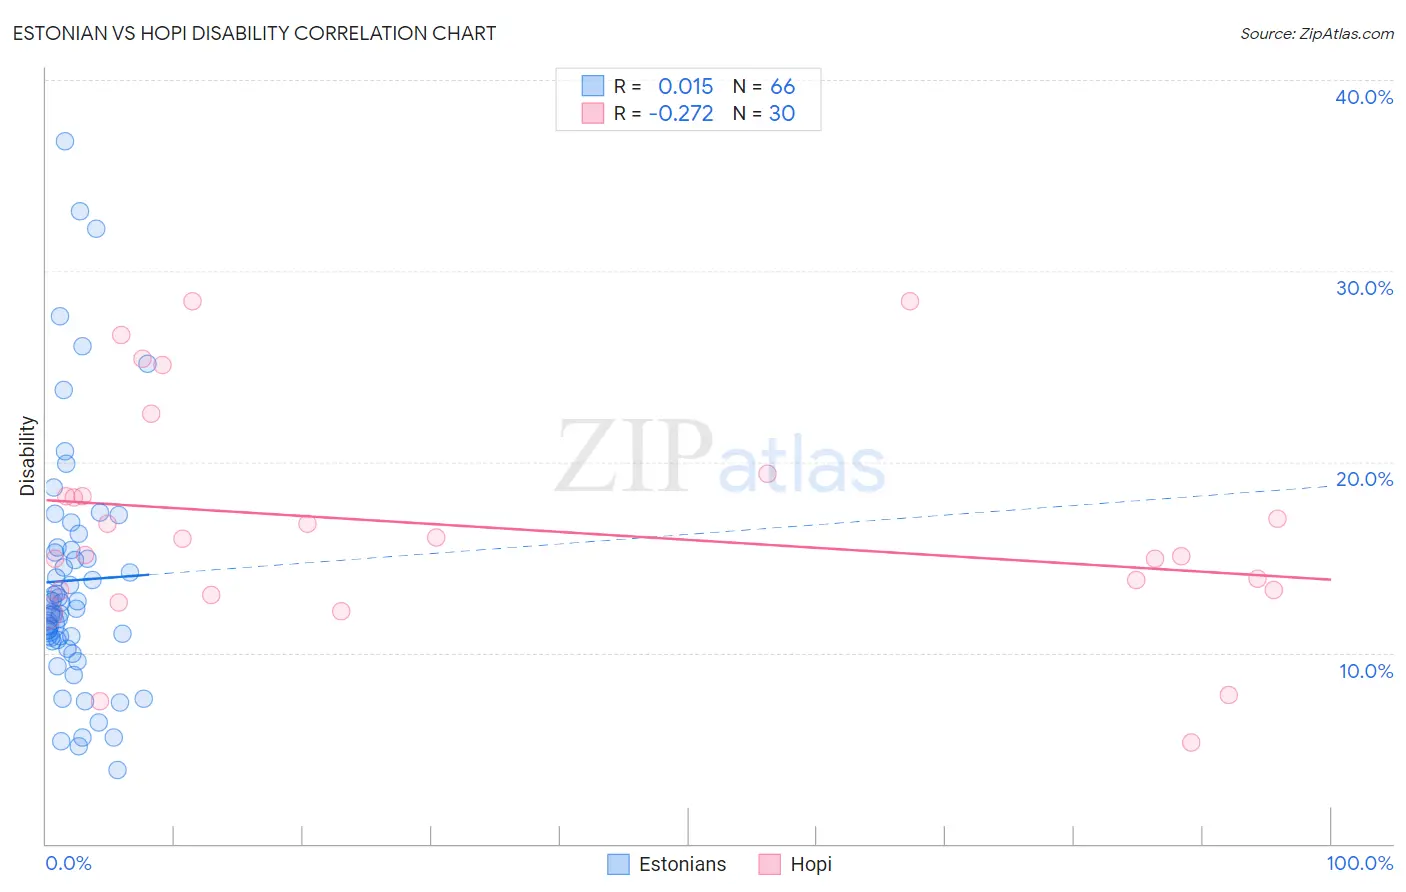
Estonian vs Hopi Disability Correlation Chart
The statistical analysis conducted on geographies consisting of 123,527,631 people shows no correlation between the proportion of Estonians and percentage of population with a disability in the United States with a correlation coefficient (R) of 0.015 and weighted average of 11.7%. Similarly, the statistical analysis conducted on geographies consisting of 74,733,532 people shows a weak negative correlation between the proportion of Hopi and percentage of population with a disability in the United States with a correlation coefficient (R) of -0.272 and weighted average of 13.2%, a difference of 12.8%.
Disability Correlation Summary
| Measurement | Estonian | Hopi |
| Minimum | 3.8% | 5.3% |
| Maximum | 36.8% | 28.4% |
| Range | 33.0% | 23.1% |
| Mean | 13.8% | 16.6% |
| Median | 12.2% | 15.6% |
| Interquartile 25% (IQ1) | 10.7% | 13.3% |
| Interquartile 75% (IQ3) | 15.4% | 18.2% |
| Interquartile Range (IQR) | 4.8% | 4.9% |
| Standard Deviation (Sample) | 6.6% | 5.8% |
| Standard Deviation (Population) | 6.5% | 5.7% |
Similar Demographics by Disability
Demographics Similar to Estonians by Disability
In terms of disability, the demographic groups most similar to Estonians are Pakistani (11.7%, a difference of 0.010%), Immigrants from Latin America (11.7%, a difference of 0.020%), Immigrants from Austria (11.7%, a difference of 0.050%), Immigrants from Albania (11.7%, a difference of 0.070%), and Immigrants from Southern Europe (11.7%, a difference of 0.070%).
| Demographics | Rating | Rank | Disability |
| Immigrants | Barbados | 64.2 /100 | #160 | Good 11.6% |
| Immigrants | Cuba | 62.8 /100 | #161 | Good 11.6% |
| Immigrants | Haiti | 59.2 /100 | #162 | Average 11.7% |
| Immigrants | Trinidad and Tobago | 58.9 /100 | #163 | Average 11.7% |
| Syrians | 58.5 /100 | #164 | Average 11.7% |
| Cubans | 56.7 /100 | #165 | Average 11.7% |
| Pakistanis | 54.7 /100 | #166 | Average 11.7% |
| Estonians | 54.4 /100 | #167 | Average 11.7% |
| Immigrants | Latin America | 54.1 /100 | #168 | Average 11.7% |
| Immigrants | Austria | 53.4 /100 | #169 | Average 11.7% |
| Immigrants | Albania | 52.8 /100 | #170 | Average 11.7% |
| Immigrants | Southern Europe | 52.8 /100 | #171 | Average 11.7% |
| Trinidadians and Tobagonians | 52.7 /100 | #172 | Average 11.7% |
| Maltese | 50.6 /100 | #173 | Average 11.7% |
| Albanians | 50.0 /100 | #174 | Average 11.7% |
Demographics Similar to Hopi by Disability
In terms of disability, the demographic groups most similar to Hopi are Alaska Native (13.2%, a difference of 0.010%), French (13.2%, a difference of 0.030%), Central American Indian (13.2%, a difference of 0.060%), Pennsylvania German (13.2%, a difference of 0.070%), and Nonimmigrants (13.2%, a difference of 0.10%).
| Demographics | Rating | Rank | Disability |
| Cheyenne | 0.0 /100 | #290 | Tragic 13.0% |
| Yaqui | 0.0 /100 | #291 | Tragic 13.1% |
| Aleuts | 0.0 /100 | #292 | Tragic 13.1% |
| Marshallese | 0.0 /100 | #293 | Tragic 13.1% |
| Celtics | 0.0 /100 | #294 | Tragic 13.1% |
| Immigrants | Nonimmigrants | 0.0 /100 | #295 | Tragic 13.2% |
| Central American Indians | 0.0 /100 | #296 | Tragic 13.2% |
| Hopi | 0.0 /100 | #297 | Tragic 13.2% |
| Alaska Natives | 0.0 /100 | #298 | Tragic 13.2% |
| French | 0.0 /100 | #299 | Tragic 13.2% |
| Pennsylvania Germans | 0.0 /100 | #300 | Tragic 13.2% |
| Immigrants | Micronesia | 0.0 /100 | #301 | Tragic 13.2% |
| Arapaho | 0.0 /100 | #302 | Tragic 13.2% |
| Scotch-Irish | 0.0 /100 | #303 | Tragic 13.3% |
| Yakama | 0.0 /100 | #304 | Tragic 13.4% |