Czechoslovakian vs Hopi Disability
COMPARE
Czechoslovakian
Hopi
Disability
Disability Comparison
Czechoslovakians
Hopi
12.5%
DISABILITY
0.2/ 100
METRIC RATING
266th/ 347
METRIC RANK
13.2%
DISABILITY
0.0/ 100
METRIC RATING
297th/ 347
METRIC RANK
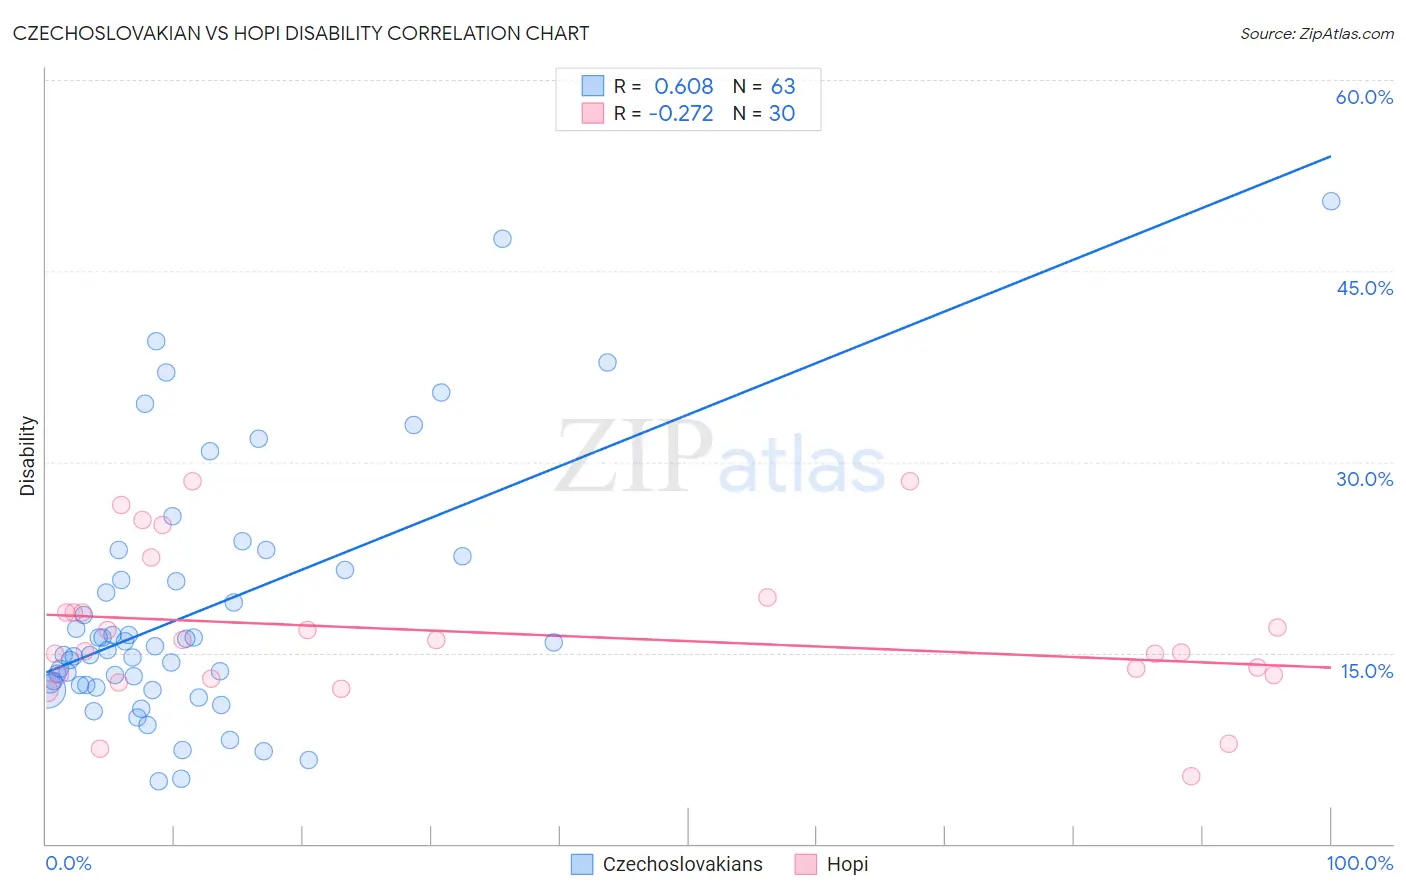
Czechoslovakian vs Hopi Disability Correlation Chart
The statistical analysis conducted on geographies consisting of 368,659,957 people shows a significant positive correlation between the proportion of Czechoslovakians and percentage of population with a disability in the United States with a correlation coefficient (R) of 0.608 and weighted average of 12.5%. Similarly, the statistical analysis conducted on geographies consisting of 74,733,532 people shows a weak negative correlation between the proportion of Hopi and percentage of population with a disability in the United States with a correlation coefficient (R) of -0.272 and weighted average of 13.2%, a difference of 5.2%.
Disability Correlation Summary
| Measurement | Czechoslovakian | Hopi |
| Minimum | 5.0% | 5.3% |
| Maximum | 50.5% | 28.4% |
| Range | 45.5% | 23.1% |
| Mean | 18.3% | 16.6% |
| Median | 15.2% | 15.6% |
| Interquartile 25% (IQ1) | 12.5% | 13.3% |
| Interquartile 75% (IQ3) | 21.6% | 18.2% |
| Interquartile Range (IQR) | 9.0% | 4.9% |
| Standard Deviation (Sample) | 9.9% | 5.8% |
| Standard Deviation (Population) | 9.8% | 5.7% |
Similar Demographics by Disability
Demographics Similar to Czechoslovakians by Disability
In terms of disability, the demographic groups most similar to Czechoslovakians are Spaniard (12.5%, a difference of 0.070%), U.S. Virgin Islander (12.5%, a difference of 0.16%), Immigrants from Germany (12.5%, a difference of 0.18%), Hawaiian (12.5%, a difference of 0.29%), and Bangladeshi (12.6%, a difference of 0.40%).
| Demographics | Rating | Rank | Disability |
| Canadians | 0.4 /100 | #259 | Tragic 12.4% |
| Immigrants | Liberia | 0.4 /100 | #260 | Tragic 12.4% |
| Scandinavians | 0.4 /100 | #261 | Tragic 12.4% |
| Native Hawaiians | 0.3 /100 | #262 | Tragic 12.5% |
| Hawaiians | 0.2 /100 | #263 | Tragic 12.5% |
| Immigrants | Germany | 0.2 /100 | #264 | Tragic 12.5% |
| U.S. Virgin Islanders | 0.2 /100 | #265 | Tragic 12.5% |
| Czechoslovakians | 0.2 /100 | #266 | Tragic 12.5% |
| Spaniards | 0.2 /100 | #267 | Tragic 12.5% |
| Bangladeshis | 0.1 /100 | #268 | Tragic 12.6% |
| Immigrants | Dominican Republic | 0.1 /100 | #269 | Tragic 12.6% |
| Portuguese | 0.1 /100 | #270 | Tragic 12.6% |
| Immigrants | Yemen | 0.1 /100 | #271 | Tragic 12.6% |
| Dominicans | 0.0 /100 | #272 | Tragic 12.7% |
| Finns | 0.0 /100 | #273 | Tragic 12.7% |
Demographics Similar to Hopi by Disability
In terms of disability, the demographic groups most similar to Hopi are Alaska Native (13.2%, a difference of 0.010%), French (13.2%, a difference of 0.030%), Central American Indian (13.2%, a difference of 0.060%), Pennsylvania German (13.2%, a difference of 0.070%), and Nonimmigrants (13.2%, a difference of 0.10%).
| Demographics | Rating | Rank | Disability |
| Cheyenne | 0.0 /100 | #290 | Tragic 13.0% |
| Yaqui | 0.0 /100 | #291 | Tragic 13.1% |
| Aleuts | 0.0 /100 | #292 | Tragic 13.1% |
| Marshallese | 0.0 /100 | #293 | Tragic 13.1% |
| Celtics | 0.0 /100 | #294 | Tragic 13.1% |
| Immigrants | Nonimmigrants | 0.0 /100 | #295 | Tragic 13.2% |
| Central American Indians | 0.0 /100 | #296 | Tragic 13.2% |
| Hopi | 0.0 /100 | #297 | Tragic 13.2% |
| Alaska Natives | 0.0 /100 | #298 | Tragic 13.2% |
| French | 0.0 /100 | #299 | Tragic 13.2% |
| Pennsylvania Germans | 0.0 /100 | #300 | Tragic 13.2% |
| Immigrants | Micronesia | 0.0 /100 | #301 | Tragic 13.2% |
| Arapaho | 0.0 /100 | #302 | Tragic 13.2% |
| Scotch-Irish | 0.0 /100 | #303 | Tragic 13.3% |
| Yakama | 0.0 /100 | #304 | Tragic 13.4% |