Celtic vs Hopi Unemployment
COMPARE
Celtic
Hopi
Unemployment
Unemployment Comparison
Celtics
Hopi
4.9%
UNEMPLOYMENT
99.1/ 100
METRIC RATING
56th/ 347
METRIC RANK
8.9%
UNEMPLOYMENT
0.0/ 100
METRIC RATING
342nd/ 347
METRIC RANK
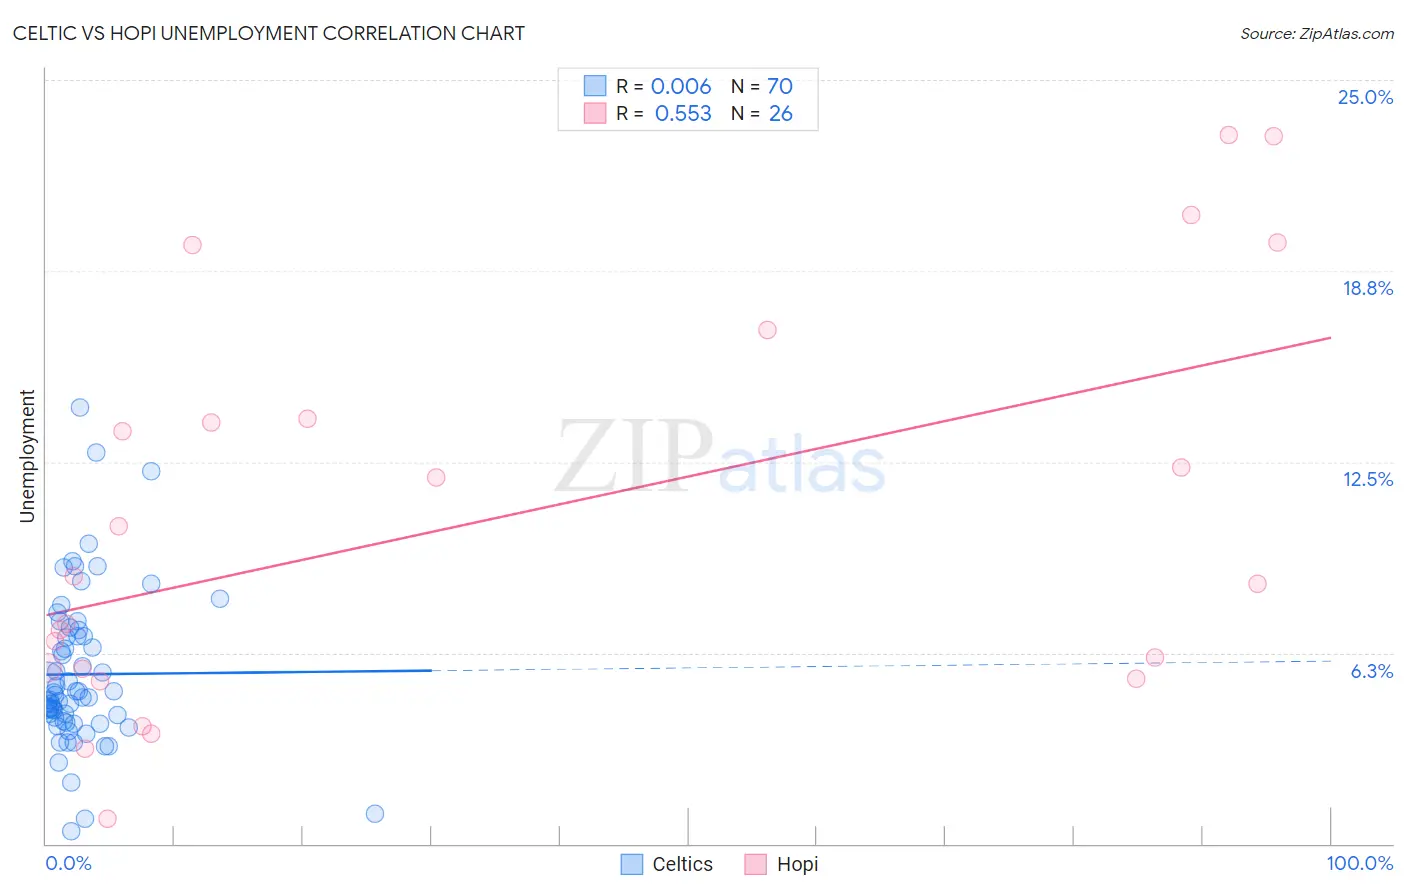
Celtic vs Hopi Unemployment Correlation Chart
The statistical analysis conducted on geographies consisting of 168,747,363 people shows no correlation between the proportion of Celtics and unemployment in the United States with a correlation coefficient (R) of 0.006 and weighted average of 4.9%. Similarly, the statistical analysis conducted on geographies consisting of 74,716,849 people shows a substantial positive correlation between the proportion of Hopi and unemployment in the United States with a correlation coefficient (R) of 0.553 and weighted average of 8.9%, a difference of 82.7%.
Unemployment Correlation Summary
| Measurement | Celtic | Hopi |
| Minimum | 0.40% | 0.80% |
| Maximum | 14.3% | 23.2% |
| Range | 13.9% | 22.4% |
| Mean | 5.5% | 10.6% |
| Median | 4.8% | 8.6% |
| Interquartile 25% (IQ1) | 4.0% | 5.7% |
| Interquartile 75% (IQ3) | 6.8% | 13.9% |
| Interquartile Range (IQR) | 2.8% | 8.2% |
| Standard Deviation (Sample) | 2.6% | 6.5% |
| Standard Deviation (Population) | 2.6% | 6.4% |
Similar Demographics by Unemployment
Demographics Similar to Celtics by Unemployment
In terms of unemployment, the demographic groups most similar to Celtics are Immigrants from Singapore (4.9%, a difference of 0.070%), Australian (4.9%, a difference of 0.16%), Greek (4.9%, a difference of 0.17%), Eastern European (4.9%, a difference of 0.19%), and Bhutanese (4.9%, a difference of 0.20%).
| Demographics | Rating | Rank | Unemployment |
| Immigrants | South Central Asia | 99.3 /100 | #49 | Exceptional 4.9% |
| French Canadians | 99.3 /100 | #50 | Exceptional 4.9% |
| Immigrants | Belgium | 99.2 /100 | #51 | Exceptional 4.9% |
| Whites/Caucasians | 99.2 /100 | #52 | Exceptional 4.9% |
| Immigrants | Zimbabwe | 99.2 /100 | #53 | Exceptional 4.9% |
| Eastern Europeans | 99.2 /100 | #54 | Exceptional 4.9% |
| Australians | 99.2 /100 | #55 | Exceptional 4.9% |
| Celtics | 99.1 /100 | #56 | Exceptional 4.9% |
| Immigrants | Singapore | 99.1 /100 | #57 | Exceptional 4.9% |
| Greeks | 99.0 /100 | #58 | Exceptional 4.9% |
| Bhutanese | 99.0 /100 | #59 | Exceptional 4.9% |
| Immigrants | Netherlands | 99.0 /100 | #60 | Exceptional 4.9% |
| Cambodians | 99.0 /100 | #61 | Exceptional 4.9% |
| Icelanders | 98.9 /100 | #62 | Exceptional 4.9% |
| Immigrants | Bulgaria | 98.9 /100 | #63 | Exceptional 4.9% |
Demographics Similar to Hopi by Unemployment
In terms of unemployment, the demographic groups most similar to Hopi are Tohono O'odham (8.9%, a difference of 0.45%), Yuman (9.1%, a difference of 1.7%), Puerto Rican (8.4%, a difference of 5.9%), Navajo (8.4%, a difference of 6.7%), and Pima (8.2%, a difference of 8.4%).
| Demographics | Rating | Rank | Unemployment |
| Immigrants | Dominican Republic | 0.0 /100 | #333 | Tragic 7.4% |
| Apache | 0.0 /100 | #334 | Tragic 7.4% |
| Alaskan Athabascans | 0.0 /100 | #335 | Tragic 7.7% |
| Immigrants | Yemen | 0.0 /100 | #336 | Tragic 7.7% |
| Cheyenne | 0.0 /100 | #337 | Tragic 8.0% |
| Pima | 0.0 /100 | #338 | Tragic 8.2% |
| Navajo | 0.0 /100 | #339 | Tragic 8.4% |
| Puerto Ricans | 0.0 /100 | #340 | Tragic 8.4% |
| Tohono O'odham | 0.0 /100 | #341 | Tragic 8.9% |
| Hopi | 0.0 /100 | #342 | Tragic 8.9% |
| Yuman | 0.0 /100 | #343 | Tragic 9.1% |
| Arapaho | 0.0 /100 | #344 | Tragic 9.8% |
| Inupiat | 0.0 /100 | #345 | Tragic 10.1% |
| Crow | 0.0 /100 | #346 | Tragic 11.1% |
| Yup'ik | 0.0 /100 | #347 | Tragic 13.6% |