Celtic vs Hopi Single Mother Households
COMPARE
Celtic
Hopi
Single Mother Households
Single Mother Households Comparison
Celtics
Hopi
6.1%
SINGLE MOTHER HOUSEHOLDS
73.3/ 100
METRIC RATING
158th/ 347
METRIC RANK
8.5%
SINGLE MOTHER HOUSEHOLDS
0.0/ 100
METRIC RATING
329th/ 347
METRIC RANK
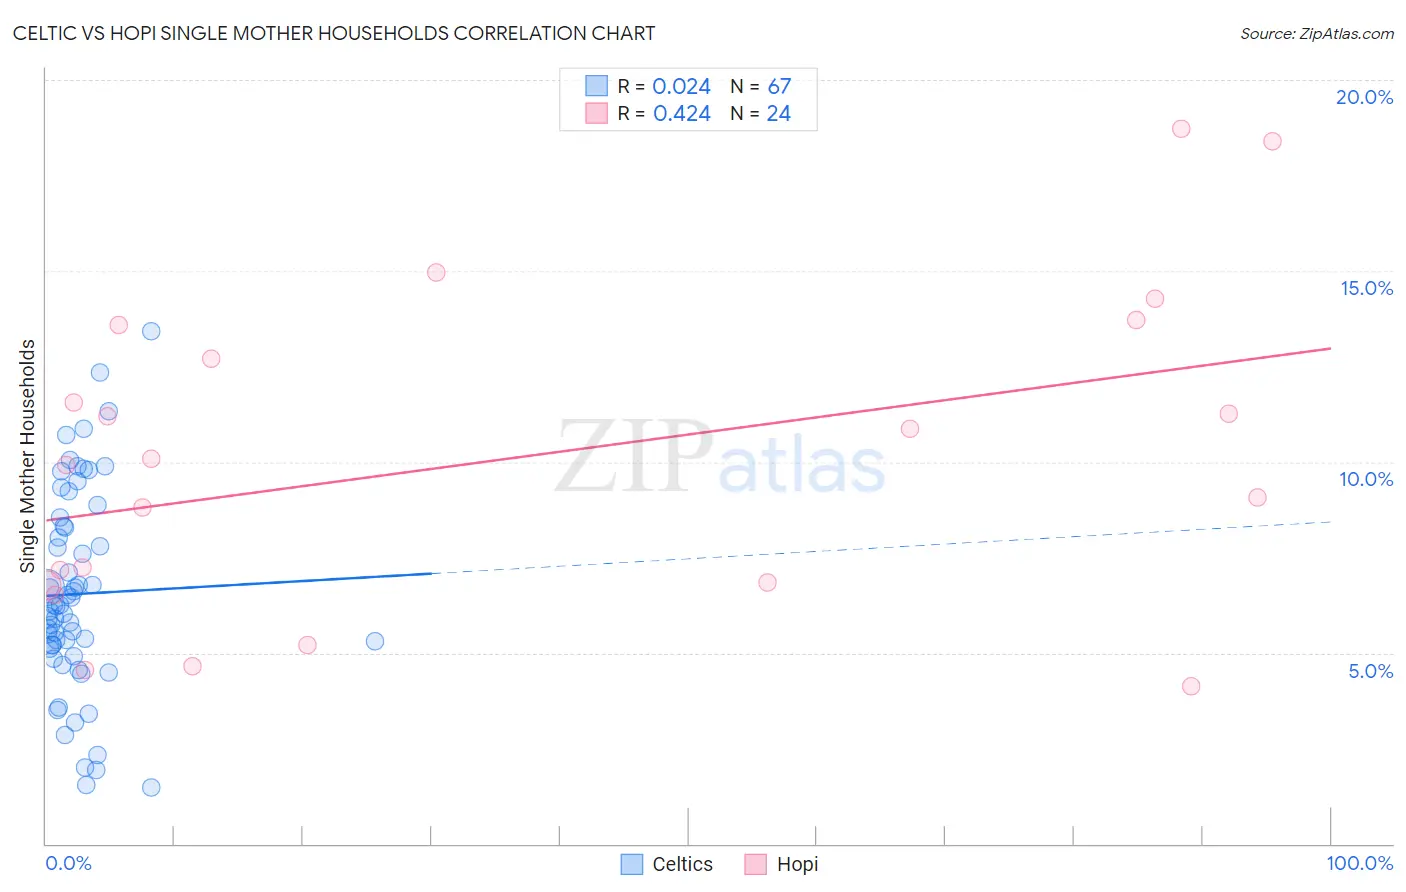
Celtic vs Hopi Single Mother Households Correlation Chart
The statistical analysis conducted on geographies consisting of 168,688,619 people shows no correlation between the proportion of Celtics and percentage of single mother households in the United States with a correlation coefficient (R) of 0.024 and weighted average of 6.1%. Similarly, the statistical analysis conducted on geographies consisting of 74,699,653 people shows a moderate positive correlation between the proportion of Hopi and percentage of single mother households in the United States with a correlation coefficient (R) of 0.424 and weighted average of 8.5%, a difference of 38.1%.
Single Mother Households Correlation Summary
| Measurement | Celtic | Hopi |
| Minimum | 1.5% | 4.1% |
| Maximum | 13.4% | 18.7% |
| Range | 11.9% | 14.6% |
| Mean | 6.5% | 10.1% |
| Median | 6.2% | 10.0% |
| Interquartile 25% (IQ1) | 5.1% | 6.8% |
| Interquartile 75% (IQ3) | 8.3% | 13.1% |
| Interquartile Range (IQR) | 3.2% | 6.4% |
| Standard Deviation (Sample) | 2.6% | 4.2% |
| Standard Deviation (Population) | 2.6% | 4.1% |
Similar Demographics by Single Mother Households
Demographics Similar to Celtics by Single Mother Households
In terms of single mother households, the demographic groups most similar to Celtics are Yugoslavian (6.1%, a difference of 0.040%), Iraqi (6.1%, a difference of 0.050%), Chilean (6.1%, a difference of 0.13%), Immigrants from Germany (6.1%, a difference of 0.13%), and Native Hawaiian (6.1%, a difference of 0.24%).
| Demographics | Rating | Rank | Single Mother Households |
| Immigrants | Southern Europe | 80.5 /100 | #151 | Excellent 6.1% |
| Pakistanis | 79.2 /100 | #152 | Good 6.1% |
| Immigrants | Brazil | 78.9 /100 | #153 | Good 6.1% |
| Immigrants | Philippines | 78.5 /100 | #154 | Good 6.1% |
| Whites/Caucasians | 76.5 /100 | #155 | Good 6.1% |
| Native Hawaiians | 75.0 /100 | #156 | Good 6.1% |
| Chileans | 74.2 /100 | #157 | Good 6.1% |
| Celtics | 73.3 /100 | #158 | Good 6.1% |
| Yugoslavians | 73.1 /100 | #159 | Good 6.1% |
| Iraqis | 73.0 /100 | #160 | Good 6.1% |
| Immigrants | Germany | 72.4 /100 | #161 | Good 6.1% |
| Immigrants | Zimbabwe | 69.9 /100 | #162 | Good 6.2% |
| Alsatians | 68.7 /100 | #163 | Good 6.2% |
| Immigrants | Northern Africa | 68.0 /100 | #164 | Good 6.2% |
| Immigrants | Syria | 67.4 /100 | #165 | Good 6.2% |
Demographics Similar to Hopi by Single Mother Households
In terms of single mother households, the demographic groups most similar to Hopi are Inupiat (8.5%, a difference of 0.11%), Sioux (8.5%, a difference of 0.11%), Yakama (8.4%, a difference of 0.75%), Immigrants from Haiti (8.4%, a difference of 0.92%), and British West Indian (8.4%, a difference of 1.1%).
| Demographics | Rating | Rank | Single Mother Households |
| Pima | 0.0 /100 | #322 | Tragic 8.3% |
| Haitians | 0.0 /100 | #323 | Tragic 8.3% |
| Immigrants | Jamaica | 0.0 /100 | #324 | Tragic 8.4% |
| Immigrants | Caribbean | 0.0 /100 | #325 | Tragic 8.4% |
| British West Indians | 0.0 /100 | #326 | Tragic 8.4% |
| Immigrants | Haiti | 0.0 /100 | #327 | Tragic 8.4% |
| Yakama | 0.0 /100 | #328 | Tragic 8.4% |
| Hopi | 0.0 /100 | #329 | Tragic 8.5% |
| Inupiat | 0.0 /100 | #330 | Tragic 8.5% |
| Sioux | 0.0 /100 | #331 | Tragic 8.5% |
| U.S. Virgin Islanders | 0.0 /100 | #332 | Tragic 8.6% |
| Liberians | 0.0 /100 | #333 | Tragic 8.6% |
| Immigrants | Liberia | 0.0 /100 | #334 | Tragic 8.7% |
| Immigrants | Dominica | 0.0 /100 | #335 | Tragic 8.7% |
| Puerto Ricans | 0.0 /100 | #336 | Tragic 8.7% |