Celtic vs Hopi Average Family Size
COMPARE
Celtic
Hopi
Average Family Size
Average Family Size Comparison
Celtics
Hopi
3.11
AVERAGE FAMILY SIZE
0.0/ 100
METRIC RATING
324th/ 347
METRIC RANK
3.60
AVERAGE FAMILY SIZE
100.0/ 100
METRIC RATING
9th/ 347
METRIC RANK
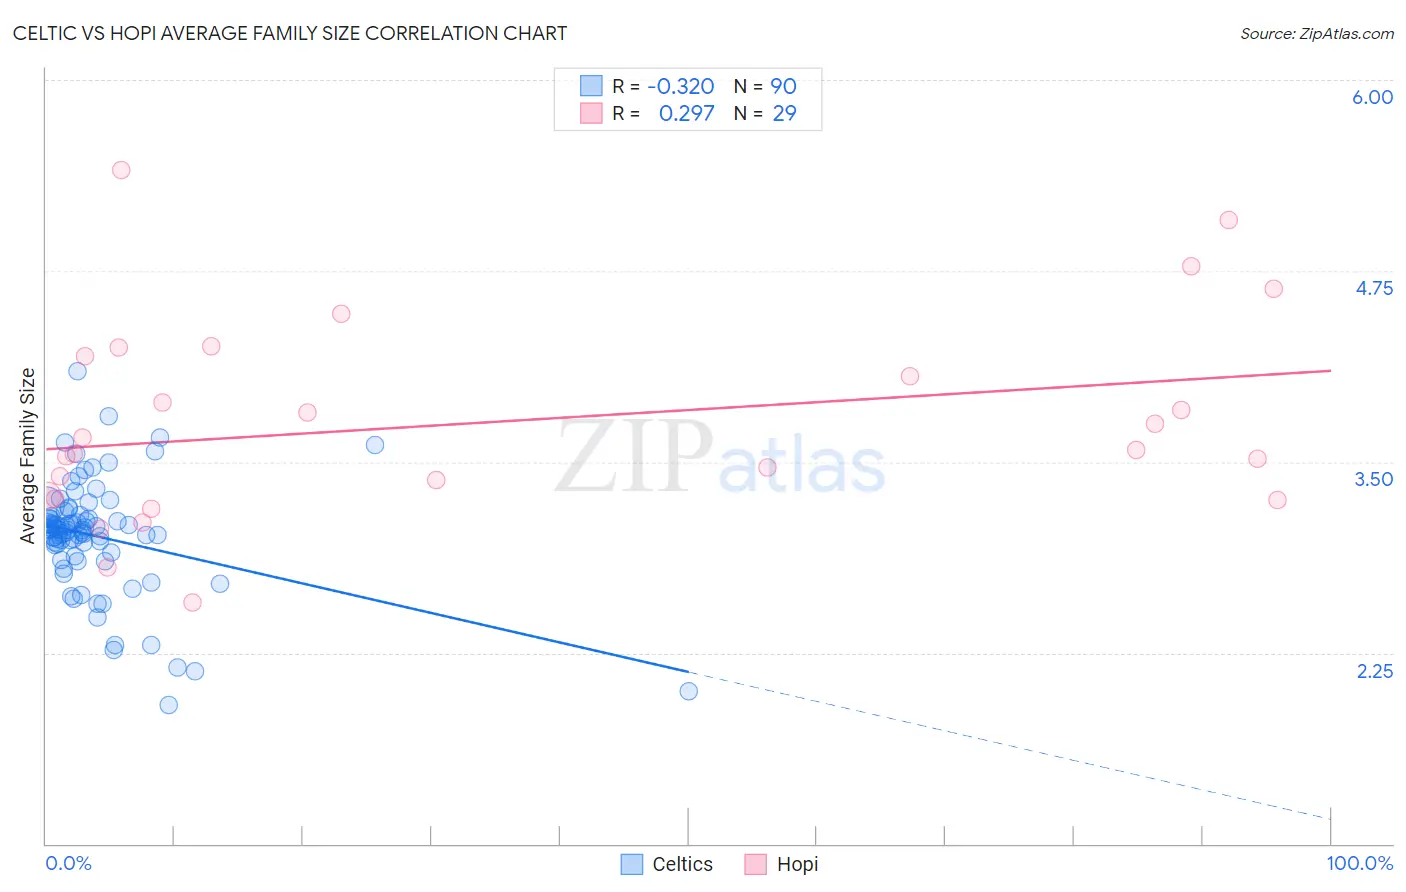
Celtic vs Hopi Average Family Size Correlation Chart
The statistical analysis conducted on geographies consisting of 168,846,519 people shows a mild negative correlation between the proportion of Celtics and average family size in the United States with a correlation coefficient (R) of -0.320 and weighted average of 3.11. Similarly, the statistical analysis conducted on geographies consisting of 74,733,485 people shows a weak positive correlation between the proportion of Hopi and average family size in the United States with a correlation coefficient (R) of 0.297 and weighted average of 3.60, a difference of 15.6%.
Average Family Size Correlation Summary
| Measurement | Celtic | Hopi |
| Minimum | 1.91 | 2.58 |
| Maximum | 4.09 | 5.41 |
| Range | 2.18 | 2.83 |
| Mean | 3.01 | 3.76 |
| Median | 3.05 | 3.58 |
| Interquartile 25% (IQ1) | 2.91 | 3.27 |
| Interquartile 75% (IQ3) | 3.15 | 4.22 |
| Interquartile Range (IQR) | 0.24 | 0.95 |
| Standard Deviation (Sample) | 0.37 | 0.67 |
| Standard Deviation (Population) | 0.37 | 0.65 |
Similar Demographics by Average Family Size
Demographics Similar to Celtics by Average Family Size
In terms of average family size, the demographic groups most similar to Celtics are English (3.11, a difference of 0.040%), Soviet Union (3.11, a difference of 0.080%), Ottawa (3.11, a difference of 0.090%), Dutch (3.11, a difference of 0.10%), and Czech (3.11, a difference of 0.10%).
| Demographics | Rating | Rank | Average Family Size |
| Italians | 0.1 /100 | #317 | Tragic 3.12 |
| Eastern Europeans | 0.1 /100 | #318 | Tragic 3.12 |
| Welsh | 0.1 /100 | #319 | Tragic 3.12 |
| Immigrants | North America | 0.0 /100 | #320 | Tragic 3.12 |
| Immigrants | Austria | 0.0 /100 | #321 | Tragic 3.12 |
| Immigrants | Canada | 0.0 /100 | #322 | Tragic 3.12 |
| Soviet Union | 0.0 /100 | #323 | Tragic 3.11 |
| Celtics | 0.0 /100 | #324 | Tragic 3.11 |
| English | 0.0 /100 | #325 | Tragic 3.11 |
| Ottawa | 0.0 /100 | #326 | Tragic 3.11 |
| Dutch | 0.0 /100 | #327 | Tragic 3.11 |
| Czechs | 0.0 /100 | #328 | Tragic 3.11 |
| Belgians | 0.0 /100 | #329 | Tragic 3.11 |
| Latvians | 0.0 /100 | #330 | Tragic 3.11 |
| Scotch-Irish | 0.0 /100 | #331 | Tragic 3.11 |
Demographics Similar to Hopi by Average Family Size
In terms of average family size, the demographic groups most similar to Hopi are Immigrants from Yemen (3.60, a difference of 0.010%), Spanish American Indian (3.58, a difference of 0.35%), Inupiat (3.63, a difference of 0.87%), Arapaho (3.64, a difference of 1.1%), and Navajo (3.65, a difference of 1.4%).
| Demographics | Rating | Rank | Average Family Size |
| Crow | 100 /100 | #2 | Exceptional 3.82 |
| Pueblo | 100 /100 | #3 | Exceptional 3.79 |
| Pima | 100 /100 | #4 | Exceptional 3.75 |
| Navajo | 100.0 /100 | #5 | Exceptional 3.65 |
| Arapaho | 100.0 /100 | #6 | Exceptional 3.64 |
| Inupiat | 100.0 /100 | #7 | Exceptional 3.63 |
| Immigrants | Yemen | 100.0 /100 | #8 | Exceptional 3.60 |
| Hopi | 100.0 /100 | #9 | Exceptional 3.60 |
| Spanish American Indians | 100.0 /100 | #10 | Exceptional 3.58 |
| Tohono O'odham | 100.0 /100 | #11 | Exceptional 3.53 |
| Immigrants | Mexico | 100.0 /100 | #12 | Exceptional 3.52 |
| Sioux | 100.0 /100 | #13 | Exceptional 3.52 |
| Immigrants | Central America | 100.0 /100 | #14 | Exceptional 3.49 |
| Tongans | 100.0 /100 | #15 | Exceptional 3.49 |
| Ute | 100.0 /100 | #16 | Exceptional 3.49 |