Aleut vs Hopi Disability
COMPARE
Aleut
Hopi
Disability
Disability Comparison
Aleuts
Hopi
13.1%
DISABILITY
0.0/ 100
METRIC RATING
292nd/ 347
METRIC RANK
13.2%
DISABILITY
0.0/ 100
METRIC RATING
297th/ 347
METRIC RANK
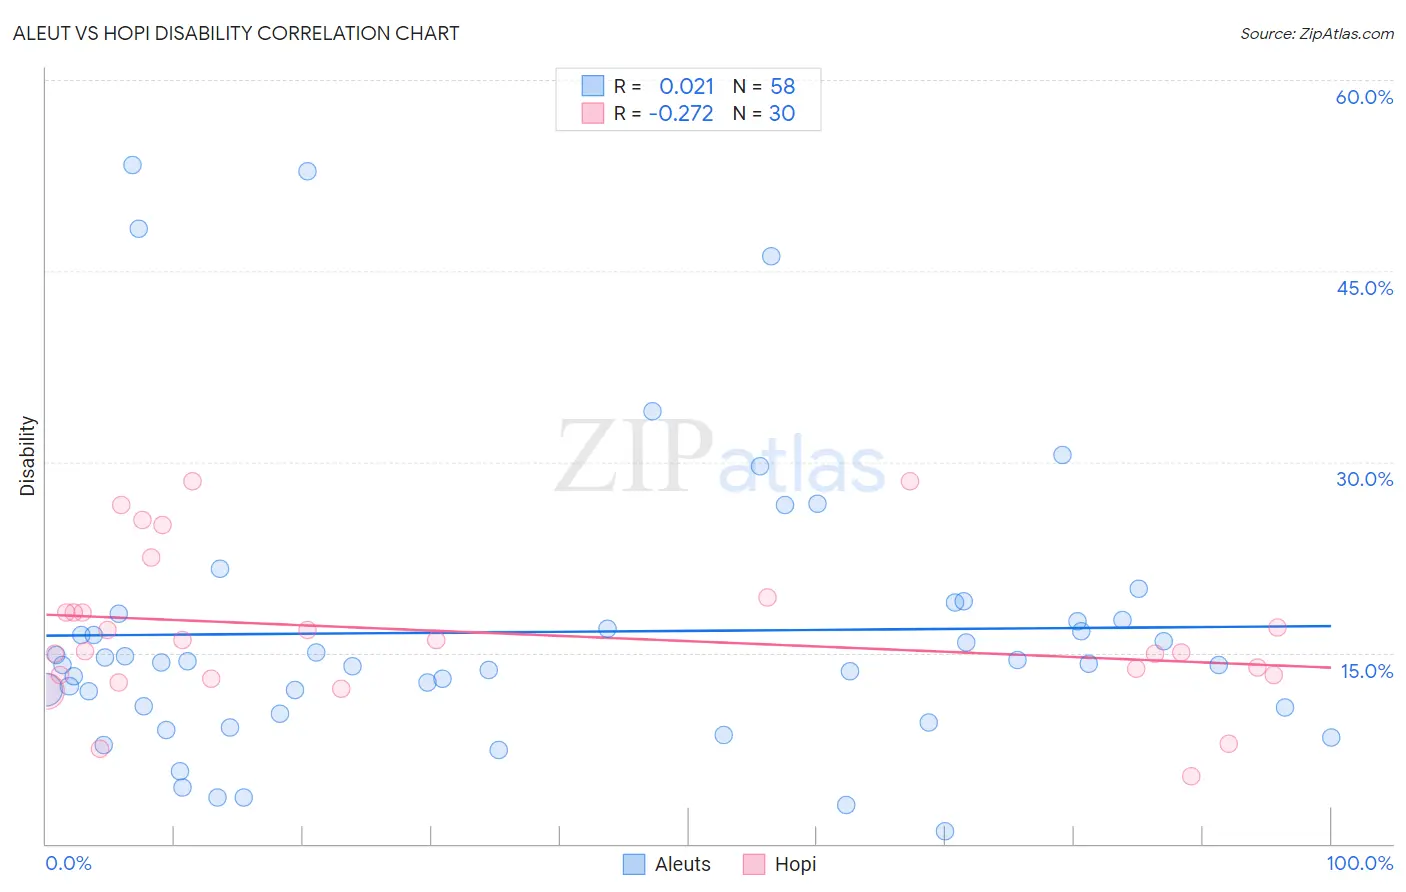
Aleut vs Hopi Disability Correlation Chart
The statistical analysis conducted on geographies consisting of 61,782,940 people shows no correlation between the proportion of Aleuts and percentage of population with a disability in the United States with a correlation coefficient (R) of 0.021 and weighted average of 13.1%. Similarly, the statistical analysis conducted on geographies consisting of 74,733,532 people shows a weak negative correlation between the proportion of Hopi and percentage of population with a disability in the United States with a correlation coefficient (R) of -0.272 and weighted average of 13.2%, a difference of 0.52%.
Disability Correlation Summary
| Measurement | Aleut | Hopi |
| Minimum | 0.97% | 5.3% |
| Maximum | 53.3% | 28.4% |
| Range | 52.4% | 23.1% |
| Mean | 16.6% | 16.6% |
| Median | 14.2% | 15.6% |
| Interquartile 25% (IQ1) | 10.7% | 13.3% |
| Interquartile 75% (IQ3) | 17.6% | 18.2% |
| Interquartile Range (IQR) | 6.9% | 4.9% |
| Standard Deviation (Sample) | 11.3% | 5.8% |
| Standard Deviation (Population) | 11.2% | 5.7% |
Demographics Similar to Aleuts and Hopi by Disability
In terms of disability, the demographic groups most similar to Aleuts are Marshallese (13.1%, a difference of 0.0%), Celtic (13.1%, a difference of 0.30%), Yaqui (13.1%, a difference of 0.36%), Nonimmigrants (13.2%, a difference of 0.42%), and Central American Indian (13.2%, a difference of 0.46%). Similarly, the demographic groups most similar to Hopi are Alaska Native (13.2%, a difference of 0.010%), French (13.2%, a difference of 0.030%), Central American Indian (13.2%, a difference of 0.060%), Pennsylvania German (13.2%, a difference of 0.070%), and Nonimmigrants (13.2%, a difference of 0.10%).
| Demographics | Rating | Rank | Disability |
| Welsh | 0.0 /100 | #284 | Tragic 12.9% |
| Crow | 0.0 /100 | #285 | Tragic 12.9% |
| English | 0.0 /100 | #286 | Tragic 13.0% |
| Africans | 0.0 /100 | #287 | Tragic 13.0% |
| Whites/Caucasians | 0.0 /100 | #288 | Tragic 13.0% |
| Slovaks | 0.0 /100 | #289 | Tragic 13.0% |
| Cheyenne | 0.0 /100 | #290 | Tragic 13.0% |
| Yaqui | 0.0 /100 | #291 | Tragic 13.1% |
| Aleuts | 0.0 /100 | #292 | Tragic 13.1% |
| Marshallese | 0.0 /100 | #293 | Tragic 13.1% |
| Celtics | 0.0 /100 | #294 | Tragic 13.1% |
| Immigrants | Nonimmigrants | 0.0 /100 | #295 | Tragic 13.2% |
| Central American Indians | 0.0 /100 | #296 | Tragic 13.2% |
| Hopi | 0.0 /100 | #297 | Tragic 13.2% |
| Alaska Natives | 0.0 /100 | #298 | Tragic 13.2% |
| French | 0.0 /100 | #299 | Tragic 13.2% |
| Pennsylvania Germans | 0.0 /100 | #300 | Tragic 13.2% |
| Immigrants | Micronesia | 0.0 /100 | #301 | Tragic 13.2% |
| Arapaho | 0.0 /100 | #302 | Tragic 13.2% |
| Scotch-Irish | 0.0 /100 | #303 | Tragic 13.3% |
| Yakama | 0.0 /100 | #304 | Tragic 13.4% |