Carpatho Rusyn vs Native Hawaiian Disability Age 5 to 17
COMPARE
Carpatho Rusyn
Native Hawaiian
Disability Age 5 to 17
Disability Age 5 to 17 Comparison
Carpatho Rusyns
Native Hawaiians
6.3%
DISABILITY AGE 5 TO 17
0.0/ 100
METRIC RATING
300th/ 347
METRIC RANK
5.2%
DISABILITY AGE 5 TO 17
99.6/ 100
METRIC RATING
81st/ 347
METRIC RANK
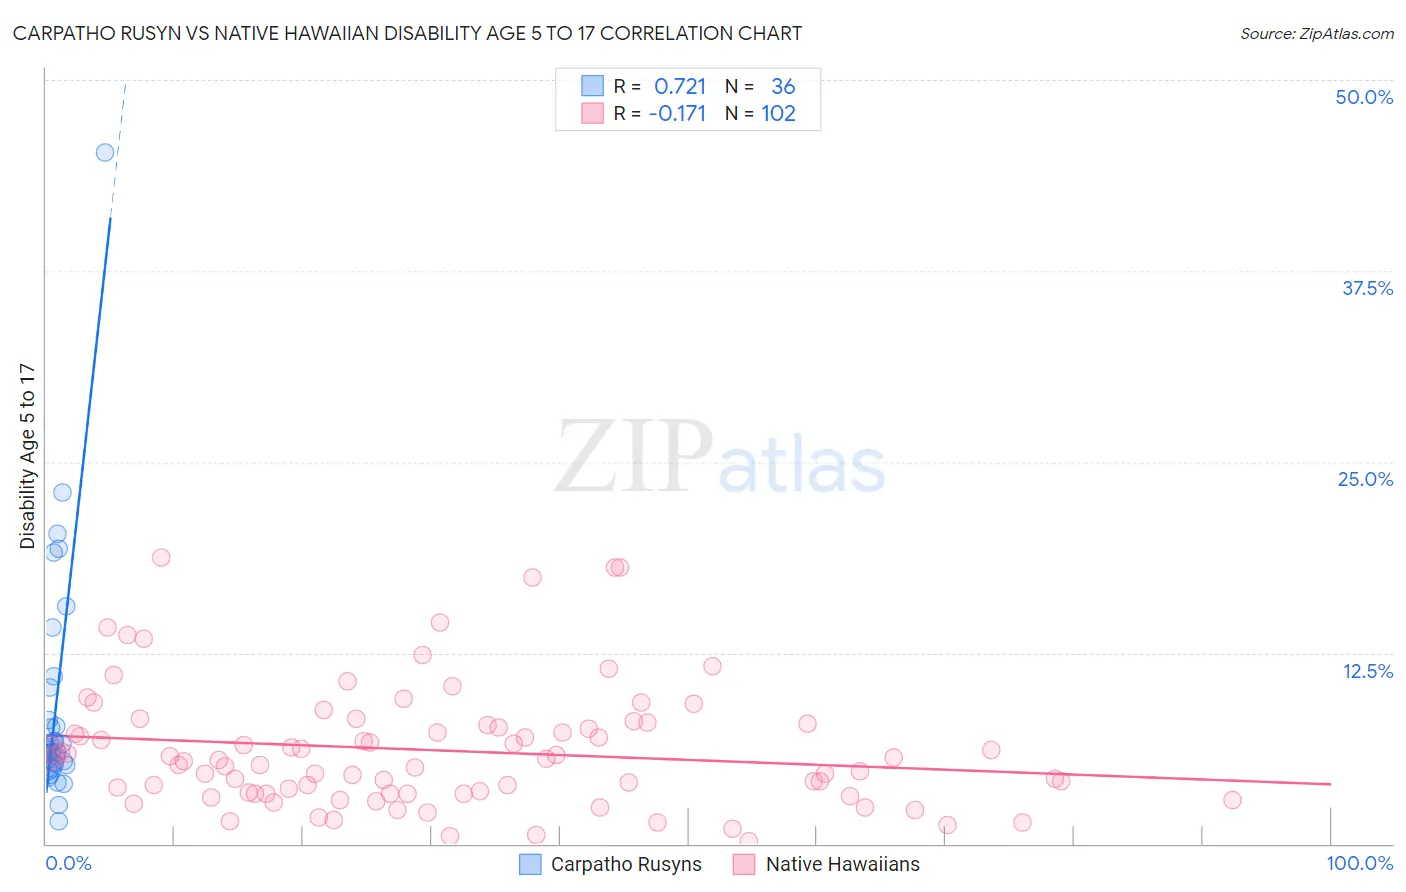
Carpatho Rusyn vs Native Hawaiian Disability Age 5 to 17 Correlation Chart
The statistical analysis conducted on geographies consisting of 58,826,840 people shows a strong positive correlation between the proportion of Carpatho Rusyns and percentage of population with a disability between the ages 5 and 17 in the United States with a correlation coefficient (R) of 0.721 and weighted average of 6.3%. Similarly, the statistical analysis conducted on geographies consisting of 329,860,359 people shows a poor negative correlation between the proportion of Native Hawaiians and percentage of population with a disability between the ages 5 and 17 in the United States with a correlation coefficient (R) of -0.171 and weighted average of 5.2%, a difference of 19.9%.
Disability Age 5 to 17 Correlation Summary
| Measurement | Carpatho Rusyn | Native Hawaiian |
| Minimum | 1.5% | 0.15% |
| Maximum | 45.2% | 18.7% |
| Range | 43.8% | 18.6% |
| Mean | 9.1% | 6.1% |
| Median | 6.1% | 5.4% |
| Interquartile 25% (IQ1) | 5.2% | 3.3% |
| Interquartile 75% (IQ3) | 9.1% | 7.8% |
| Interquartile Range (IQR) | 4.0% | 4.5% |
| Standard Deviation (Sample) | 8.1% | 4.0% |
| Standard Deviation (Population) | 8.0% | 4.0% |
Similar Demographics by Disability Age 5 to 17
Demographics Similar to Carpatho Rusyns by Disability Age 5 to 17
In terms of disability age 5 to 17, the demographic groups most similar to Carpatho Rusyns are U.S. Virgin Islander (6.3%, a difference of 0.020%), Welsh (6.3%, a difference of 0.12%), Lumbee (6.2%, a difference of 0.27%), Immigrants from Bahamas (6.2%, a difference of 0.34%), and Celtic (6.3%, a difference of 0.35%).
| Demographics | Rating | Rank | Disability Age 5 to 17 |
| Central American Indians | 0.0 /100 | #293 | Tragic 6.2% |
| Irish | 0.0 /100 | #294 | Tragic 6.2% |
| Cree | 0.0 /100 | #295 | Tragic 6.2% |
| Spanish Americans | 0.0 /100 | #296 | Tragic 6.2% |
| Immigrants | Bahamas | 0.0 /100 | #297 | Tragic 6.2% |
| Lumbee | 0.0 /100 | #298 | Tragic 6.2% |
| Welsh | 0.0 /100 | #299 | Tragic 6.3% |
| Carpatho Rusyns | 0.0 /100 | #300 | Tragic 6.3% |
| U.S. Virgin Islanders | 0.0 /100 | #301 | Tragic 6.3% |
| Celtics | 0.0 /100 | #302 | Tragic 6.3% |
| Yakama | 0.0 /100 | #303 | Tragic 6.3% |
| Senegalese | 0.0 /100 | #304 | Tragic 6.3% |
| Natives/Alaskans | 0.0 /100 | #305 | Tragic 6.3% |
| Immigrants | Nonimmigrants | 0.0 /100 | #306 | Tragic 6.3% |
| Bahamians | 0.0 /100 | #307 | Tragic 6.3% |
Demographics Similar to Native Hawaiians by Disability Age 5 to 17
In terms of disability age 5 to 17, the demographic groups most similar to Native Hawaiians are Sri Lankan (5.2%, a difference of 0.040%), Afghan (5.2%, a difference of 0.070%), Immigrants from Cuba (5.2%, a difference of 0.10%), Immigrants from Kazakhstan (5.2%, a difference of 0.11%), and Immigrants from Sweden (5.2%, a difference of 0.11%).
| Demographics | Rating | Rank | Disability Age 5 to 17 |
| Immigrants | Romania | 99.7 /100 | #74 | Exceptional 5.2% |
| Immigrants | Moldova | 99.6 /100 | #75 | Exceptional 5.2% |
| Immigrants | Guyana | 99.6 /100 | #76 | Exceptional 5.2% |
| Immigrants | Kazakhstan | 99.6 /100 | #77 | Exceptional 5.2% |
| Immigrants | Cuba | 99.6 /100 | #78 | Exceptional 5.2% |
| Afghans | 99.6 /100 | #79 | Exceptional 5.2% |
| Sri Lankans | 99.6 /100 | #80 | Exceptional 5.2% |
| Native Hawaiians | 99.6 /100 | #81 | Exceptional 5.2% |
| Immigrants | Sweden | 99.5 /100 | #82 | Exceptional 5.2% |
| Immigrants | France | 99.5 /100 | #83 | Exceptional 5.2% |
| Immigrants | Nicaragua | 99.5 /100 | #84 | Exceptional 5.2% |
| Bulgarians | 99.4 /100 | #85 | Exceptional 5.2% |
| Immigrants | St. Vincent and the Grenadines | 99.4 /100 | #86 | Exceptional 5.2% |
| Eastern Europeans | 99.4 /100 | #87 | Exceptional 5.2% |
| Immigrants | Croatia | 99.4 /100 | #88 | Exceptional 5.2% |