Carpatho Rusyn vs Indian (Asian) Disability Age 5 to 17
COMPARE
Carpatho Rusyn
Indian (Asian)
Disability Age 5 to 17
Disability Age 5 to 17 Comparison
Carpatho Rusyns
Indians (Asian)
6.3%
DISABILITY AGE 5 TO 17
0.0/ 100
METRIC RATING
300th/ 347
METRIC RANK
4.6%
DISABILITY AGE 5 TO 17
100.0/ 100
METRIC RATING
8th/ 347
METRIC RANK
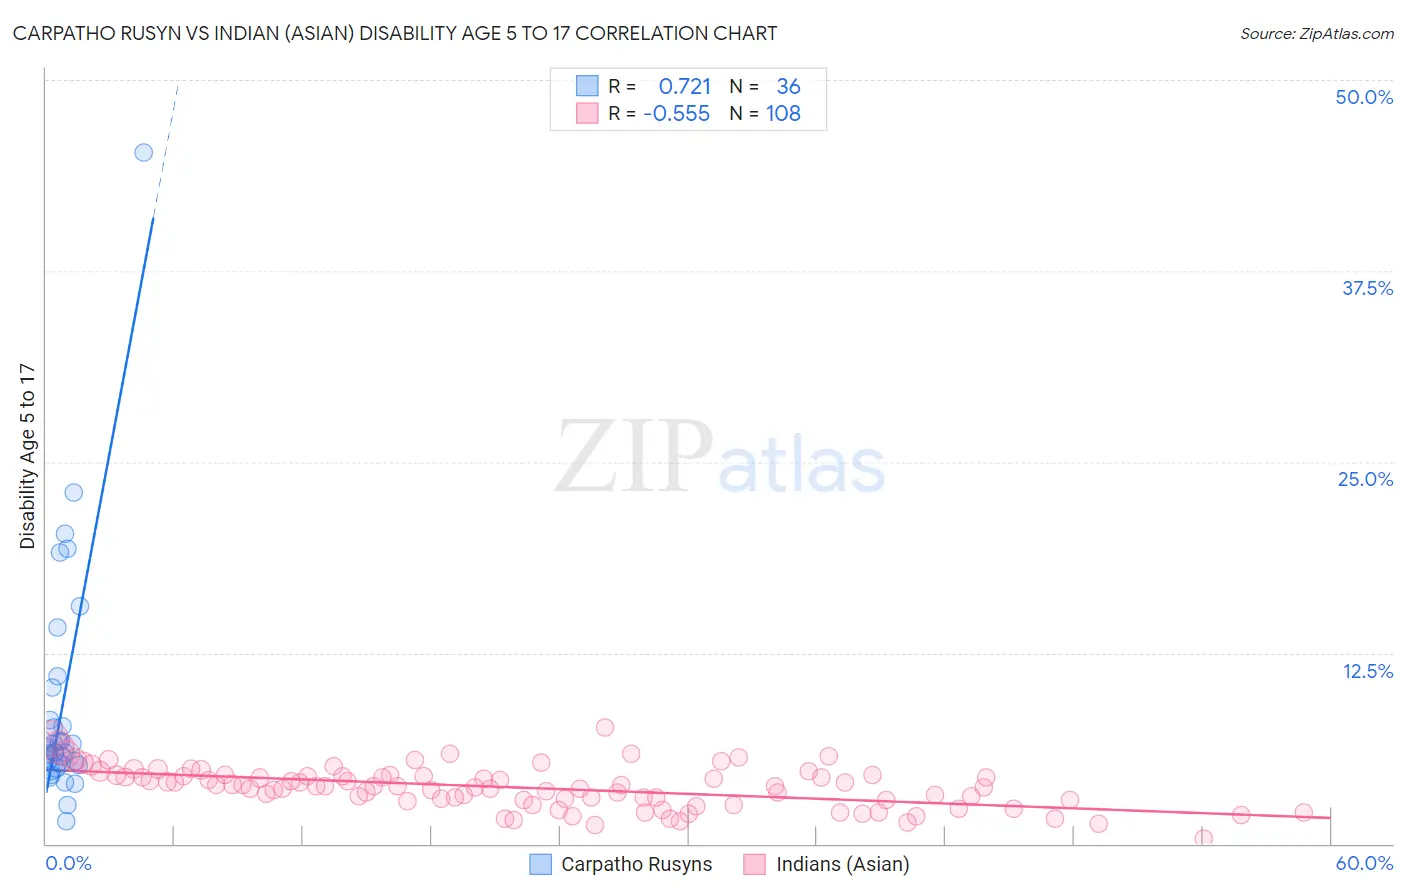
Carpatho Rusyn vs Indian (Asian) Disability Age 5 to 17 Correlation Chart
The statistical analysis conducted on geographies consisting of 58,826,840 people shows a strong positive correlation between the proportion of Carpatho Rusyns and percentage of population with a disability between the ages 5 and 17 in the United States with a correlation coefficient (R) of 0.721 and weighted average of 6.3%. Similarly, the statistical analysis conducted on geographies consisting of 488,980,607 people shows a substantial negative correlation between the proportion of Indians (Asian) and percentage of population with a disability between the ages 5 and 17 in the United States with a correlation coefficient (R) of -0.555 and weighted average of 4.6%, a difference of 37.1%.
Disability Age 5 to 17 Correlation Summary
| Measurement | Carpatho Rusyn | Indian (Asian) |
| Minimum | 1.5% | 0.35% |
| Maximum | 45.2% | 7.6% |
| Range | 43.8% | 7.3% |
| Mean | 9.1% | 3.7% |
| Median | 6.1% | 3.8% |
| Interquartile 25% (IQ1) | 5.2% | 2.8% |
| Interquartile 75% (IQ3) | 9.1% | 4.4% |
| Interquartile Range (IQR) | 4.0% | 1.6% |
| Standard Deviation (Sample) | 8.1% | 1.3% |
| Standard Deviation (Population) | 8.0% | 1.3% |
Similar Demographics by Disability Age 5 to 17
Demographics Similar to Carpatho Rusyns by Disability Age 5 to 17
In terms of disability age 5 to 17, the demographic groups most similar to Carpatho Rusyns are U.S. Virgin Islander (6.3%, a difference of 0.020%), Welsh (6.3%, a difference of 0.12%), Lumbee (6.2%, a difference of 0.27%), Immigrants from Bahamas (6.2%, a difference of 0.34%), and Celtic (6.3%, a difference of 0.35%).
| Demographics | Rating | Rank | Disability Age 5 to 17 |
| Central American Indians | 0.0 /100 | #293 | Tragic 6.2% |
| Irish | 0.0 /100 | #294 | Tragic 6.2% |
| Cree | 0.0 /100 | #295 | Tragic 6.2% |
| Spanish Americans | 0.0 /100 | #296 | Tragic 6.2% |
| Immigrants | Bahamas | 0.0 /100 | #297 | Tragic 6.2% |
| Lumbee | 0.0 /100 | #298 | Tragic 6.2% |
| Welsh | 0.0 /100 | #299 | Tragic 6.3% |
| Carpatho Rusyns | 0.0 /100 | #300 | Tragic 6.3% |
| U.S. Virgin Islanders | 0.0 /100 | #301 | Tragic 6.3% |
| Celtics | 0.0 /100 | #302 | Tragic 6.3% |
| Yakama | 0.0 /100 | #303 | Tragic 6.3% |
| Senegalese | 0.0 /100 | #304 | Tragic 6.3% |
| Natives/Alaskans | 0.0 /100 | #305 | Tragic 6.3% |
| Immigrants | Nonimmigrants | 0.0 /100 | #306 | Tragic 6.3% |
| Bahamians | 0.0 /100 | #307 | Tragic 6.3% |
Demographics Similar to Indians (Asian) by Disability Age 5 to 17
In terms of disability age 5 to 17, the demographic groups most similar to Indians (Asian) are Immigrants from Eastern Asia (4.6%, a difference of 0.33%), Immigrants from India (4.6%, a difference of 0.40%), Armenian (4.6%, a difference of 0.56%), Iranian (4.6%, a difference of 0.80%), and Immigrants from China (4.5%, a difference of 0.93%).
| Demographics | Rating | Rank | Disability Age 5 to 17 |
| Immigrants | Armenia | 100.0 /100 | #1 | Exceptional 4.1% |
| Immigrants | Taiwan | 100.0 /100 | #2 | Exceptional 4.2% |
| Immigrants | Hong Kong | 100.0 /100 | #3 | Exceptional 4.3% |
| Filipinos | 100.0 /100 | #4 | Exceptional 4.3% |
| Immigrants | Iran | 100.0 /100 | #5 | Exceptional 4.4% |
| Immigrants | Israel | 100.0 /100 | #6 | Exceptional 4.5% |
| Immigrants | China | 100.0 /100 | #7 | Exceptional 4.5% |
| Indians (Asian) | 100.0 /100 | #8 | Exceptional 4.6% |
| Immigrants | Eastern Asia | 100.0 /100 | #9 | Exceptional 4.6% |
| Immigrants | India | 100.0 /100 | #10 | Exceptional 4.6% |
| Armenians | 100.0 /100 | #11 | Exceptional 4.6% |
| Iranians | 100.0 /100 | #12 | Exceptional 4.6% |
| Thais | 100.0 /100 | #13 | Exceptional 4.7% |
| Immigrants | Korea | 100.0 /100 | #14 | Exceptional 4.7% |
| Chinese | 100.0 /100 | #15 | Exceptional 4.7% |